All in One View
Content from Why distribute your data through VizieR?
Last updated on 2023-09-14 | Edit this page
Overview
Questions
- What is VizieR?
- What is a VizieR catalogue?
- How is VizieR interoperable?
Objectives
- Describe the contents of a VizieR catalogue
- List some VO tools interoperable with VizieR catalogues
- Outline the benefits of submitting your data to VizieR
What is VizieR?
VizieR provides the most complete library of published astronomical catalogues - tables and associated data - with verified and enriched data, accessible via multiple interfaces. Query tools allow the user to select relevant data tables and to extract and format records matching given criteria. Currently, ~ 24 000 catalogues are available (as in August 2023).
Interactive window: VizieR homepage webpage. Note that you can type in (it is not an image).
VizieR was initially started as a joint effort of CDS (Centre de Données astronomiques de Strasbourg) and ESA-ESRIN (Information Systems Division), and is now fully managed by CDS. VizieR has been available since 1996, and was described in a paper published in 2000 (DOI: 10.1051/aas:2000169).
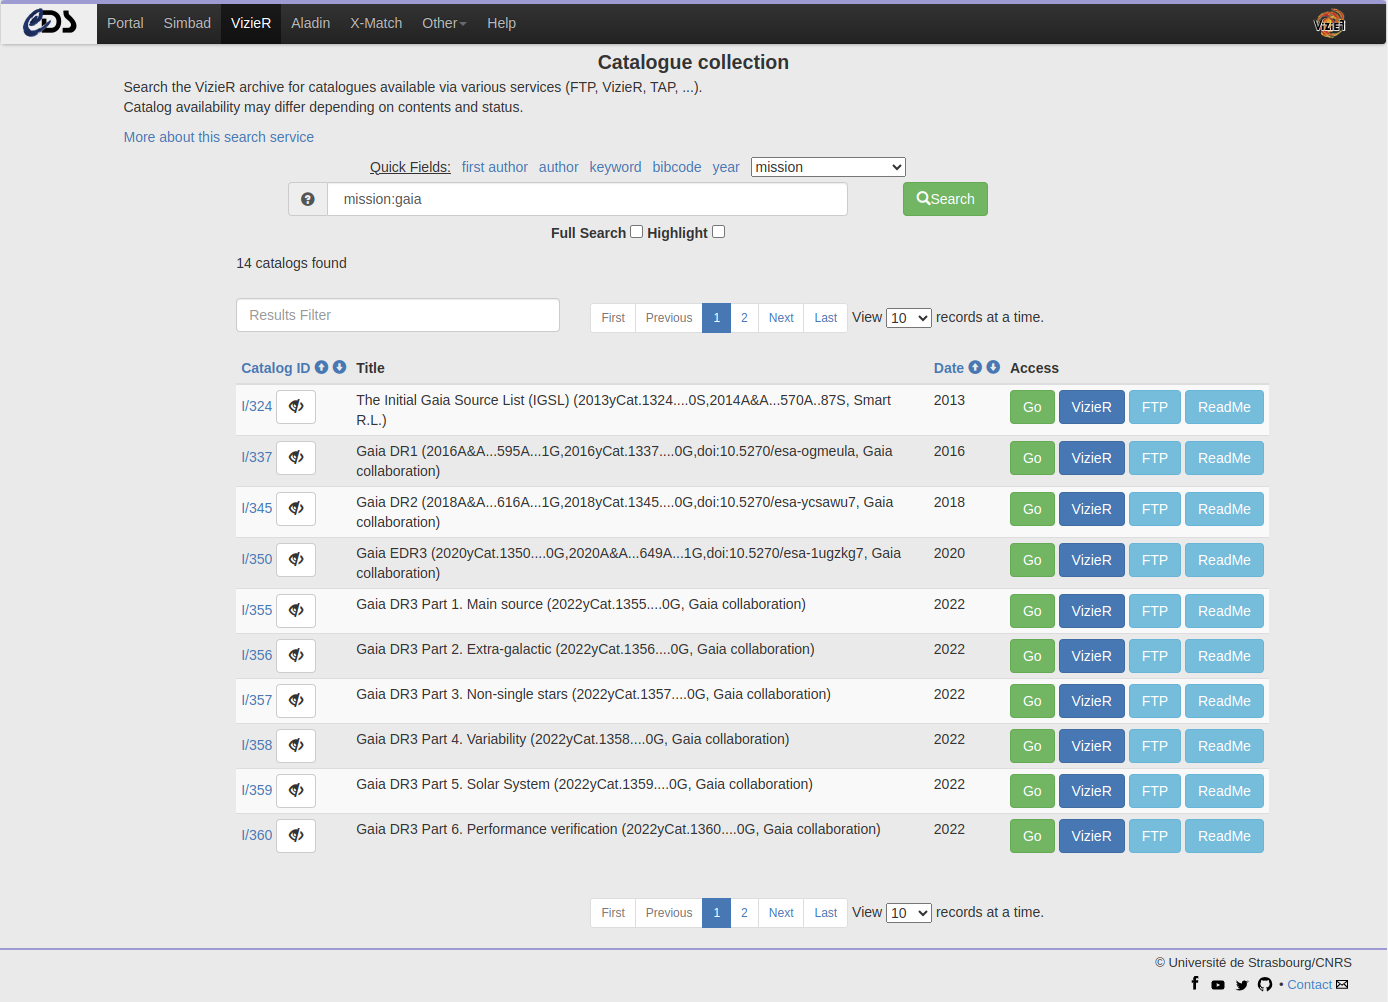
Note that VizieR does not contain all available online catalogues: some catalogues are not suitable and some less frequently used catalogues have not yet been incorporated into the VizieR database. The full list of catalogues is available from there: Catalogue collection page.
VizieR and more generally speaking the CDS are quite involved in the data preservation aspect, as evidenced by the DSA and CTS certifications awarded over the last years. More details on the topic can be found at the page below.
Interactive window: CDS webpage related to the CoreTrustSeal certification.
What is a VizieR catalogue?
We call a VizieR catalogue:
- A set of documented tables (including a ReadMe file), linked to a published paper
- With an indexation by keywords, authors, date, UCDs …
- With a global indexation by position whenever possible
- And citation capability (bibcode or DOI)
A catalogue can optionally contains other data types, also associated with publications. Here is a non exhaustive list:
- Photometric information: this will populate the VizieR SED service
- FITS Spectra, images and cubes: this will populate the associated Saada/VizieR database
- Time series and spectra: they will be displayed as interactive plot (see example of interactive time serie plot)
- Table of references (see example of refs.dat file)
- Time measurements: this allows for time comparisons, for example with Time MOCs in Aladin
- Solar system information: it will be added to the VizieR B/planets catalogue and populate the VESPA site
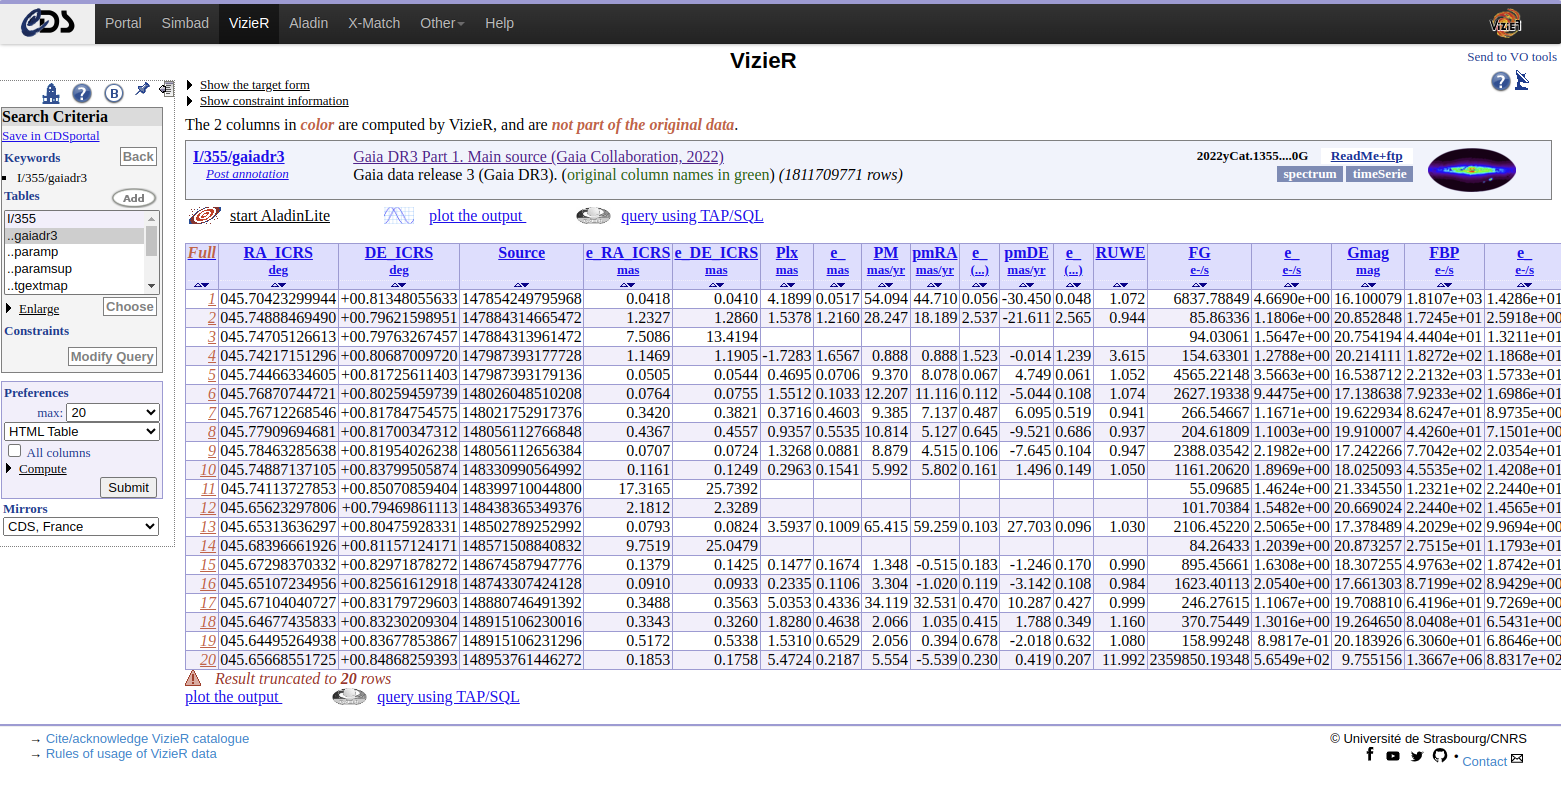
Interactive window: VizieR catalogue landing page, example for Gaia DR3 Part 1 (VizieR name: I/355).
VizieR catalogue and CDS tools
Once a catalogue is ingested in VizieR, one can access a range of tools:
- Query the VizieR table(s)
- Access to the FTP (archived VizieR tables as described by the ReadMe)
- Query VizieR table(s) using TAP/SQL
- Perform a fast cross-match identification between VizieR tables or Simbad
- Load your tables in Aladin
- Plot photometry (“SED”) including all VizieR
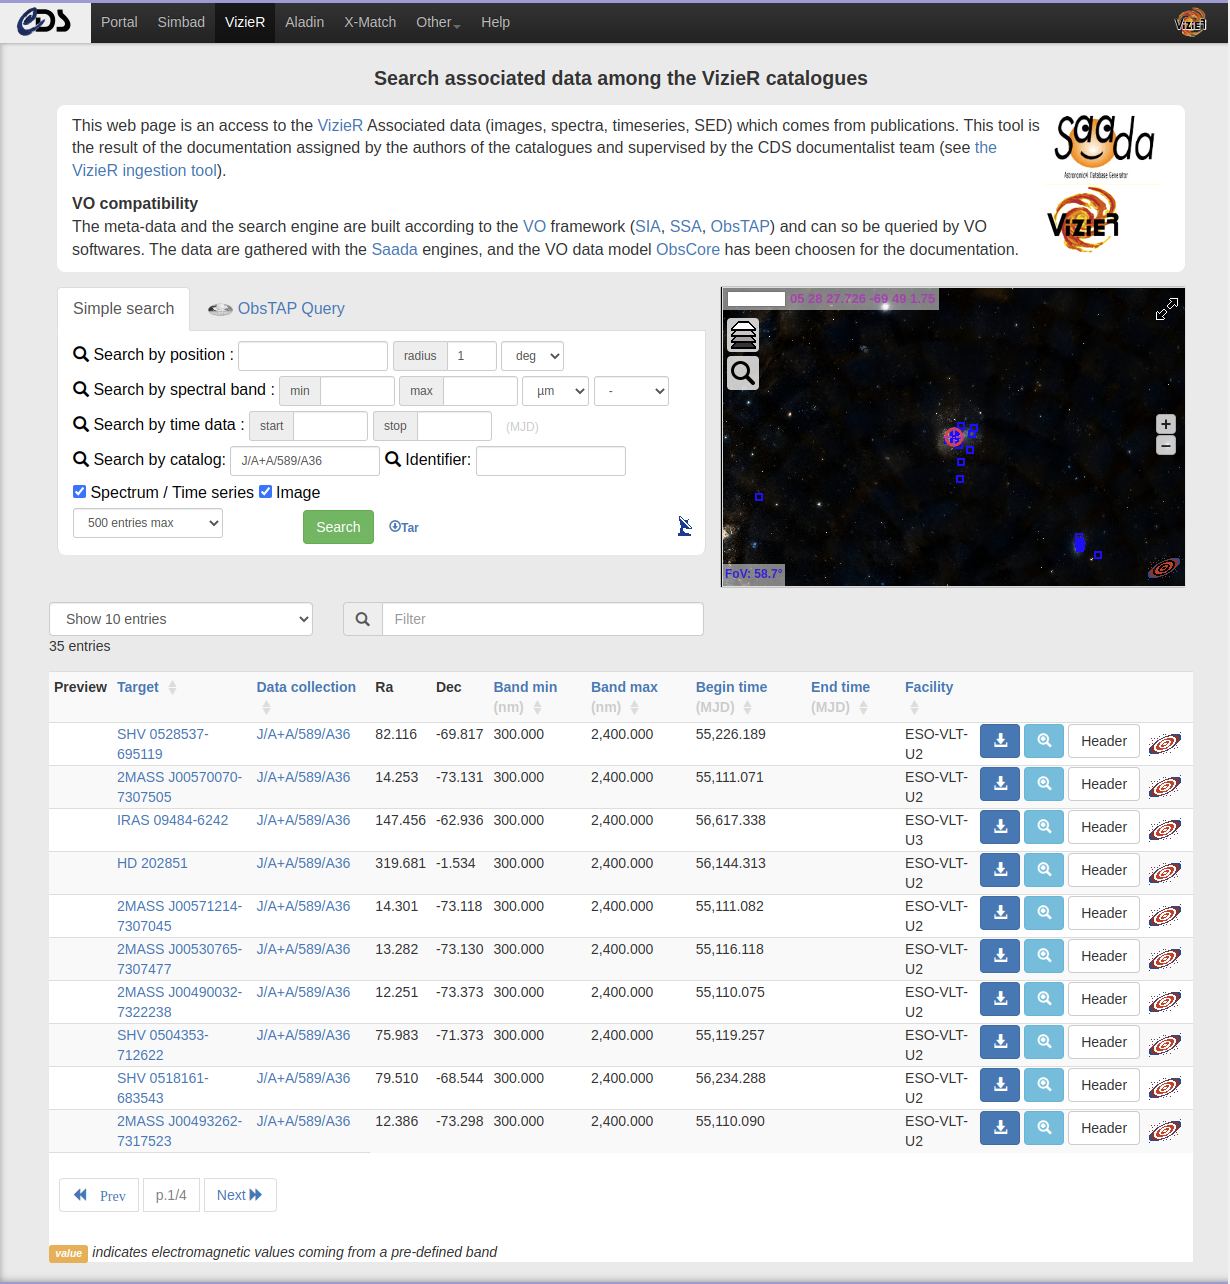
- Query VizieR associated data
(images, spectra)
- Query all VizieR catalogues using CDS Python package
- VizieR tables with astronomical objects can be processed in SIMBAD.

Why distribute your data through VizieR?
In addition to the interoperability with the VO tools mentioned above, distributing your data through VizieR means adding values to them.
- Step in search engine:
- VO Registries: CDS Registry, IVOA Registry of Registries (RofR)
- Eudat
- Astrophysics Data System (ADS)
- European Open Science Cloud (EOSC) Portal
- Step in the VO: interoperability with other tools, e.g.
- Load your data as a VO Table using TOPCAT
- Visualize a spectrum using CASSIS
- Analyze a spectrum using Splat
- Analyze your data using astroquery
- Added metadata:
- UCD (VO)
- Keywords (UAT)
- Protocol (ADQL)
- DOI (Citation)
- Bibcode
- MOC
Summary: Benefits of using VizieR
Distribute your data in a trusted repository in accordance with Open Data principles
- Data preservation: The CDS has been awarded the Core Trust Seal.
-
Discovery: Take advantage of the VizieR services
allowing for the discovery, and a good data visibility
- Dedicated indexations
- Quality and a good data description
- Generate persistent identifier (bibcode, DOI) for citation
- Data are available through the Virtual Observatory (VO) services
- Data can be queried by various means (simple search, TAP, Python …) and retrieved in different format (ASCII, Fits, VOTable …)
Next chapters
In the next chapters, you will learn what type of data can be submitted, how to prepare and submit them to VizieR, and finally how to search your data using the EOSC tools.
Content from FAIR principles for astronomical data
Last updated on 2023-11-06 | Edit this page
Overview
Questions
- What are the FAIR principles?
- What does it mean for astronomical data?
- Do and don’t when publishing data
Objectives
- Cite the Findable, Accessible, Interoperable and Reusable (FAIR) principles
- Create FAIR tables
Overview
The CDS and other astronomical data centers are storing and distributing the astronomical data to promote their usage primarily by professional astronomers.
In order to ensure the scientific quality of the data, we therefore require that the data are related to a publication in a refereed journal, either as tables or catalogues actually published, or as a paper describing the data and their context.
Furthermore, the data should be described accurately enough to allow an unambiguous interpretation (of the data), and facilitate their usability.
In this chapter, we will review the best practices for data publication in the astronomical field.

What are the FAIR principles?
Formalized by Wilkinson et al. in 2016 (DOI: 10.1038/sdata.2016.18), the FAIR Guiding Principles have emerged over the last few years. The underlying idea is to provide a set of guidelines (neither a standard not a specification) for making research data in a broad sense (not only data, but also algorithms, tools, and workflows that led to that data) Findable, Accessible, Interoperable and Reusable, ultimately ensuring standardised machine actionability.
Many great courses can be found online explaining those principles in more details. In this course, we will summarize them and focus more on what it means for astronomical data.
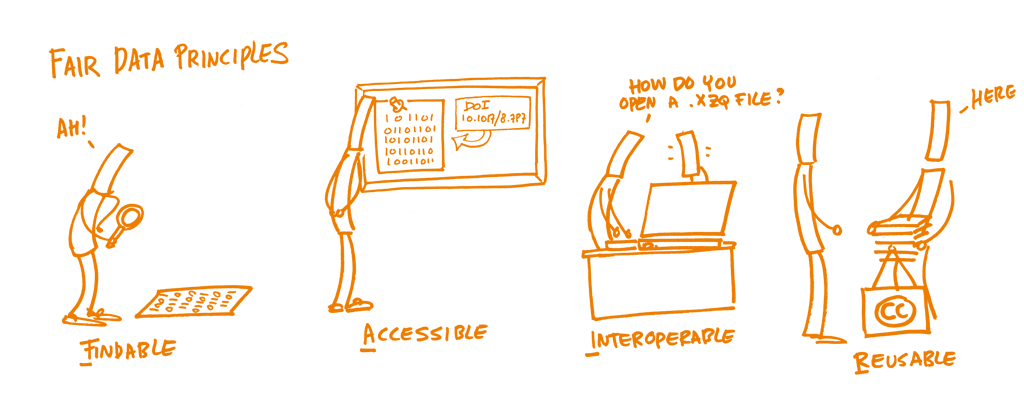 Credit: Open Science Training Handbook, CC0 1.0 Universal, https://doi.org/10.5281/zenodo.1212496
The FAIR Guiding Principles in more depth
The FAIR Guiding Principles for scientific data management and stewardship as outlined by M. Wilkinson et al. (2016).
The first step before reusing the data is to be able to find them. The metadata and data should be easy to find for both humans and computers.
F1. (Meta)data are assigned a globally unique and persistent identifier
F2. Data are described with rich metadata (defined by R1 below)
F3. Metadata clearly and explicitly include the identifier of the data it describes
F4. (Meta)data are registered or indexed in a searchable resource
Once the data can be found, the user needs to know how to access them. That could include authentification and authorisation. The accessibility of the data does not imply that they are fully open to everyone.
The data should be ‘as open as possible, as closed as necessary’, following the H2020 Program Guidelines on FAIR Data.
A1. (Meta)data are retrievable by their identifier using a standardized communications protocol
- A1.1 The protocol is open, free, and universally implementable
- A1.2 The protocol allows for an authentication and authorization procedure, where necessary
A2. Metadata are accessible, even when the data are no longer available
Those data can then be combined with different datasets, and interoperate with other applications or workflows for analysis, storage, and processing, thanks to rich metadata.
I1. (Meta)data use a formal, accessible, shared, and broadly applicable language for knowledge representation.
I2. (Meta)data use vocabularies that follow FAIR principles
I3. (Meta)data include qualified references to other (meta)data
The ultimate goal of FAIR is to optimise the reuse of data. To achieve this, metadata and data should be well-described, including a clear and accessible license. It should be clear how the data can and cannot be reused, remixed or redistributed.
R1. Meta(data) are richly described with a plurality of accurate and relevant attributes
- R1.1. (Meta)data are released with a clear and accessible data usage license
- R1.2. (Meta)data are associated with detailed provenance
- R1.3. (Meta)data meet domain-relevant community standards
Best Practices for Data Publication in the Astronomical Literature
In 2022, Chen et al. (DOI: 10.3847/1538-4365/ac6268) published a set of guidelines summarizing the best practices for publishing data in astronomy and astrophysics journals. This article is the result of a joint effort from several data centres (NED, CfA, Caltech, CDS, AAS, ADS, among others), as these recommendations are applicable to all those who do data processing.
These recommendations are intended for authors, referees, and science editors to consult in order to avoid various pit-falls that often impede the interpretation of data and metadata by readers, and parsing by software, and therefore also complicate and delay integration of the data into astronomical databases.
Everyone is encouraged to read their paper. For the sake of this course, only their Checklist of Recommendations for Publishing Data in the Literature (Appendix A of their paper) is included below.
Items covered in the Checklist (and also below):
- General rules
- Nomenclature
- Astrometry
- Photometry
- Time
- Redshift/velocity
- Classifications
- Orbital parameters
- Tables
- Figures
- Data archiving and access
- Literature citations
- Facility credits
- Software credits
- Digital object identifiers - DOI
- Data content keywords
Keep calm and carry on
A lot of items will be covered in this section. We are aware that you could be a bit overwhelmed.
The most important points are highlighted in bold, and some tips when creating tables are given at the end.
Do your best and do not hesitate to contact us if needed: cds-cats(at)unistra.fr.
General rules(Section §2 from article)
- Define all symbols, acronyms, and abbreviations at first use.
- Provide uncertainty and confidence level when reporting a new measurement.
- Present the appropriate number of significant figures for numerical measurements and uncertainties that match the precision of the measurements.
- Report the units for measurements if present, and adopt commonly-used ones.
- Indicate preferred values if applicable.
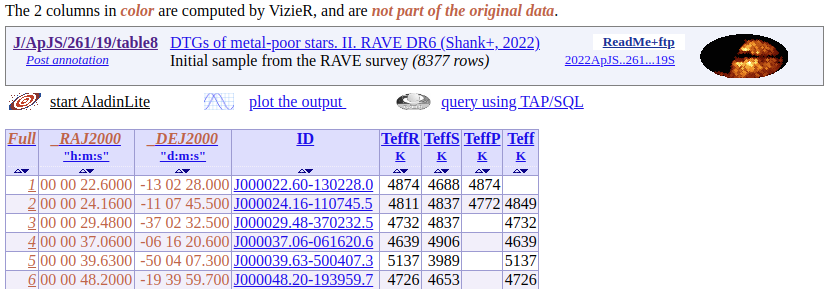
Examples
a) “... used by the Dark Energy Survey (DES)...”
b) The period of a periodic phenomenon should be given as
“P = 1.23456±0.00012 days” instead of “P = 1.23456(12) days”.
c) Present a measurement as 0.123±0.002,
not 0.12345±0.002 or 0.123±0.00234.
d) Present source color “(B-V) = 0.45 mag” instead of “(B-V) = 0.45”
e) State your preferred solution in the text and have a dedicated column
for the adopted solution in your Table, as shown in Table 8 from VizieR catalogue J/ApJS/261/19
Nomenclature (§2.1)
- Provide the complete name for each object. (§2.1.1)
- Include the “J” in names based on J2000 coordinates. (§2.1.1)
- Insert spacers between a catalogue name and the identifiers within the catalogue. (§2.1.1)
- Distinguish between part of an object and the object itself. (§2.1.1)
- Do not use the same name for different objects. (§2.1.1)
- Always assign a name and verify the name is unique. (§2.1.2)
- Keep the appropriate number of significant figures in coordinate-based names. (§2.1.2)
- Use established names for known objects and check for the correct formatting. (§2.1.3)
- Confirm the names and positions for cross-identifications. (§2.1.4)
- Cross-match the same objects in different tables within the same article. (§2.1.4)
Examples
## IAU conventions
a) Use “2MASS J15334944+3759282”, and not “2M 1533+3759”.
b) Use “BR J0529-3526” instead of “BR0529-3526” (which is B1950 by default).
c) Use “B3 2327+391”, and not “B32327+391”.
d) Use “3C 295 cluster” instead of “3C 295” when referring to the cluster.
e) The tau Ceti system now has four planets: e, f, g, and h.
Since tau Ceti b, c, and d were refuted, the letter designations b, c,
and d were not reused for the newer planets to avoid confusion.

## New objects
f) Confirm any new acronym to the Dictionary of Nomenclature of
Celestial Objects.
g) J092712.64+294344.0 indicates a positional accuracy of 0.15 arcsec
while J092712.644+294344.02 indicates an accuracy of 0.015 arcsec.

## Known objects
h) Creating a fanciful name for an object with an existing designation
is especially discourage.
h) Validate all the identifiers for known objects in their publications
through Sesame.
A service hosted by CDS that queries NED, SIMBAD, and VizieR to help
resolve object names.

## Cross-identifications
i) Always verify with established databases that all of the names
given to an object are valid cross-identifications for the object and
that the listed positions are for the same object.
Quiz
Quiz: Why are these astronomical designations improper?
Q1) J2217+2104
Q2) SN 95B
Q3) HESS J232+202
Q4) BR 0529-3526
Q5) B0008+006
Q6) DEM45
Q7) Gaia 2448177130188111232
Q8) Gaia DR 2 2.7904e18
Q9) mu cep
Look for these objects in Simbad.
Can you find them?
I1) Insufficient precision in RA and DEC causes confusion. In this case, it could correspond to many objects and different surveys.
I2) Incomplete name can be interpreted into different objects.
I3) Leading zero in RA is missing and can cause misinterpretation of the RA at 23 hours instead of 02 hour.
I4) Missing letter J to specify J2000 equatorial coordinates.
I5) Name prefix is needed to distinguish between different objects.
I6) H II regions in LMC or SMC should be indicated with “L” or “S” to avoid ambiguity.
I7) Database objectID number is used without specifying release number. The same running number may refer to a different source in a different release.
I8) ID is written in scientific notation, making it impossible to retrieve the actual object (which is a 19-integer number).
I9) Ambiguous name can be interpreted into different objects.
R1) LAMOST J221750.59+210437.1 and SDSS J221746.82+210424.1 are potential matches for this incomplete name
R2) SN 1895B and SN 1995B are different targets
R3) HESS J0232+202
R4) BR J0529-3526
R5) QSO B0008+006 (Redshift z = 2.3) and IVS B0008+006 (Redshift z = 1.5) are different targets
R6) DEM L 045, or DEM S 045
R7) Gaia DR3 2448177130188111232
R8) Gaia DR2 2790494815860044544
R9) µ Cep (Simbad Identifier: * mu. Cep, 21h43m30.46s, +58d46m48.2s, J2000) and MU Cep (Simbad Identifier: V* MU Cep, 22h23m38.63s, +57d40m50.8s, J2000) are different targets
Astrometry (§2.2)
- Provide the best available coordinates.
- Specify the celestial reference system and/or frame.
- Indicate the equinox and epoch of observation when necessary.
- State the wavelength range from which astrometry is obtained.
Examples
a) Complete celestial coordinates are preferred, e.g.,
12h34m56.78s, +12d34m56.7s (Equatorial J2000).
b) Current IAU celestial reference system is ICRS:
the International Celestial Reference System.
c) Standard equinox and epoch currently in use are J2000.0,
but it is not always the case. For example, the reference epoch
for the Gaia Data Release 3 is ICRS at epoch = 2016.0,
while it is epoch = 2015.5 for Gaia Data Release 2
and epoch = 2015.0 for Gaia Data Release 1.
Photometry (§2.3)
- State the facility, telescope and instrument used.
- Describe the method used to estimate photometry.
- Use standard passband/filter identifiers.
- Clarify the magnitude system.
- Specify spectral transitions completely.
Examples
a) Facility ground-based or space-based, specific instrument configuration information.
b) Point spread function fitting, aperture photometry, etc.
c) Indicate “Johnson B” or “Cousins B” instead of just “B”;
use “2MASS Ks” instead of just “K”.
d) Magnitude on the AB, Vega, ST, or some other magnitude system.
e) Carbon monoxide (CO) has several detectable transitions as do ^13^CO
and C^17^O. The most commonly observed transition is (J=1-0) and each is
between 110 and 115 GHz. To clearly define a spectral transition,
one should use, e.g., “CO (J=1-0) ν=115 GHz”.
Time (§2.4)
- Provide the time of observation and exposure time.
- Favor full Julian Dates over abbreviated or offset Julian Dates.
- Include phase timing measures along with reported periods when relevant.
- State when observations from multiple missions are executed simultaneously.
Examples
a) Explicitly described in terms of both the frame of reference
(e.g., JD, BJD, HJD), and the time system used (e.g., UTC, TDB, TAI).
For example, use “BJD-TDB” to indicate Barycentric Julian Date
in the Barycentric Dynamical Time standard (preferred).
b) When reporting Julian Dates, the full unmodified date (e.g., 2456789.123)
is preferred over any offset variation (e.g., 6789.123), to avoid confusion.
Note that MJD (Modified Julian Date) is = Julian Date - 2400000.5, by IAU definition.
c) For a transiting exoplanet orbit where the period is known,
include a time of transit.
d) If possible, include a graphical representation of the times that
the missions obtained the data to help visualize where the simultaneity occurs.
Redshift/velocity (§2.5)
- Describe the method of redshift measurements (spectroscopic, photometric, etc.) and give references to the model/method.
- Specify the reference frame of the redshift measurements (barycentric, heliocentric, galactocentric, etc.).
- Provide the frequency/wavelength from which the measurement is obtained.
- State whether a published recessional velocity is based on observed frequency or wavelength shifts (i.e., radio or optical convention).
- Indicate the quality of the measurement when possible.
Examples
a) Describe particular method (spectroscopic, photometric, Friends-of-Friends, etc.)
and base assumptions used in the models (template fitting, machine learning, etc).
b) Include a clear indication of the reference frame, e.g., heliocentric,
barycentric, Galactocentric, or LSR (Local Standard of Rest).
c) A redshift measured from HI 21 cm emission line may have a significantly
different systematic velocity than a redshift measured from stellar absorption lines
in the same galaxy.
d) The radio velocity increment depends upon the rest frequency,
whereas the optical velocity increment depends on the observing frequency.
e) Add a flag indicating low quality as poor seing or
redshift based on a single spectral line.
Classifications (§2.6)
- Utilize established classifications as available.
- Define (new) classifications clearly.
Examples
a) For basic morphological types, use well-established schemes
(e.g., Sandage 2005).
Authors are encouraged to refer to SIMBAD’s Object Classification
or NED’s galaxy classifications and attributes, which have been standardized
to enable unified queries across journal articles and catalogues.
b) Explain any abbreviations and/or give a definition of the classification.
Orbital parameters (§2.7)
- Avoid using “longitude of periapsis” in place of “argument of periapsis”.
- Be explicit about which body’s orbit a longitude or argument of periapsis refers to (e.g., planet or host star).
- Include time of periapsis as appropriate.
Examples
a) Only use “longitude of periapsis” when referring to the sum of
the argument of periapsis and the longitude of the ascending node.
b) The argument of periapsis for a planet or a secondary star’s orbit
differs from that of the host or primary star’s reflex motion by 180 degrees.
c) When reporting timing for a non-transiting eccentric orbit for
which argument of periapsis is measured, report time of periapsis in preference to
(or in addition to) time of inferior conjunction. Both are preferred if possible. Tables(Section §3.1 from article)
- Provide a clear title and unambiguous labels for columns.
- Explain the content of each column, including symbols and flags.
- Keep each column homogeneous.
- Use the same explicitly defined non-numeric representations for missing (null) values throughout.
- Prepare ReadMe files for machine-readable tables.
- Give the complete names of the objects (§2.1) in each table, and keep the same names in all the tables and text throughout the article when possible.
Examples
a) Indicate the units for each column when applicable.
b) Make a clear distinction between z the redshift, z the filter or z the metallicity.
c) A single column should not present measurements with different units,
mix errors with limits or comments, or append flags to values.

d) Use null values that are supported and documented by widely-used
toolkits, e.g., “NaN” (Not a Number) for floating-point data in Astropy.
Use the same representation for missing data and have a separate field
that explains the reasons for a missing value.
Do not use different representations to indicate the different reasons.

Wrong example: Using 0.00 for “not observed”, and -99.99 for “no detection” in the same column.
Stick to only one NULL value per column!

e) Authors should include a human-readable description of the data,
with at least the column descriptions, units, and references (on the
origin of the measurements or instruments for observations when relevant)
in a ReadMe file. More help on the ReadMe is given in the Chapter "Submitting astronomical data".
Quiz
Quiz: How to make this table FAIR?
| Object | Redshift |
|---|---|
| Source 1 | 0.11 |
| Source 2 | 0.22 |
| Source 3 | 0.31 |
| Source 4 | 0.41 |
| Source 5 | 0.52 |
Redshift quality flag: 1 = secure, 2 = uncertain
The quality of the measurement is indicated using a superscript. Providing this information using an extra column will make the table more machine readable, and therefore the data more reusable.
| Object | Redshift | Quality |
|---|---|---|
| Source 1 | 0.1 | 1 |
| Source 2 | 0.2 | 2 |
| Source 3 | 0.3 | 1 |
| Source 4 | 0.4 | 1 |
| Source 5 | 0.5 | 2 |
Redshift quality flag: 1 = secure, 2 = uncertain
Figures (§3.2)
- Provide clear caption, legend and axis labels for each figure.
- Design the graphics to be accessible.
- Make “data behind the plots” publicly available.
Examples
a) Describe in detail what is presented in the figure, what different
colors, symbols, and lines represent. Units of the axis labels should
be included when applicable. In practice, figures should be able to
stand alone without requiring much reading of the main text.
b) Color-blind users would benefit from symbols that vary in shape
in addition to colors. See the AAS journals’ graphics guide for more advice.
c) Make the original data files used to generate the figures publicly
available, as this will greatly enhance the ability to reproduce,
validate, or build upon published results.
Those files will also be harvested by CDS (as shown in the example below).
Interactive window: Example of spectra generated by VizieR based on original data files (“data behind figure”).
Data archiving and access (Section §4 from article)
- Append small data sets as part of the publication.
- Deposit large or complex data at a long-term archive most appropriate for your data. Adhere to the specific format requirements from the archives.
- Provide a complete list of metadata.
- Include a Data Availability Statement if required by the journal.
- Do not publish data sets at URLs lacking long-term support.
- Use unique and informative names for the files instead of duplicating file names and using location in a directory structure as file metadata necessary to uniquely identify a file.
Examples
a) Preserve data as supplementary materials with your final journal
article, or post the data files with your arXiv preprint.
b) If the data are either too large or too complex to be hosted by the
journal, authors are encouraged to place their data in a trusted
repository that issues Digital Object Identifiers (DOIs).
c) Visualize the position and orientation of the apertures on imagery,
key metadata including aperture dimensions, center coordinates,
and position angle are required.
d) Example from MNRAS.
e) We strongly discourage the publication of URLs to personal web servers
hosting data sets for which the author or institution has no means to maintain
for many years after the publication of the associated journal article.
f) if photometry data are available at different bands (e.g., V and R)
for the same object (e.g., NGC 1275), use names such as NGC1275_V.dat
and NGC1275_R.dat to identify the files. Do not set up separate directories
for V and R band, and give the same file name NGC1275.dat under both directories.
Literature citations (Section §5.1 from article)
- Cite the original references.
- Use preferred citations by the authors.
- Provide full provenance of the data. Credit the originator of archival data, including the Principal Investigator.
- Include all references in the bibliography section.
- Distinguish original data in your article and data taken from other work.
Examples
a)  “We adopted a heliocentric redshift of 1.234 (Smith et al. 2012)
via NED”, where “Smith et al. 2012” is listed correctly in your bibliography.
b) The 2MASS web page requests that you cite the canonical paper by
Skrutskie et al. (2006), instead of the Explanatory Supplement.
d) Make sure all appropriate references to papers, software and data
products are included in a paper’s bibliography section, not just in footnotes.
e) Use phrases such as “This work” to clearly identify original
data in your article.
Facility credits (§5.2)
- Indicate the facilities involved, such as telescopes, instruments, and databases.
- Use standard keywords when possible.
- Include facility’s own statement if available.
Examples
a) Always describe the facilities or services used,
and make sure the name is unique.
b) See AAS keyword tags with AASTeX \facility and \facilities.
c) This research has made use of the VizieR catalogue access tool, CDS,
Strasbourg, France (DOI: 10.26093/cds/vizier). The original description
of the VizieR service was published in 2000, A&AS 143, 23.
Quiz
Quiz: Can you guess the names of these facilities?
Q1) ARO
Q2) DDO
Q3) EMIR
Q4) OSIRIS
| Names as published | Possible interpretation |
|---|---|
| ARO | Astronomical Research Observatory |
| Arizona Radio Observatory | |
| Abbey Ridge Observatory | |
| Algonquin Radio Observatory | |
| DDO | David Dunlap Observatory:0.15m |
| David Dunlap Observatory:0.5m | |
| David Dunlap Observatory:0.6m | |
| David Dunlap Observatory:1.88m | |
| EMIR | Eight MIxer Receiver (on the IRAM 30m radio telescope) |
| Espectrógrafo Multiobjeto Infra-Rojo (on the Gran Telescopio Canarias) | |
| OSIRIS | OH-Suppressing Infra-Red Imaging Spectrograph (on the Keck I telescope) |
| Ohio State Infrared Imager/Spectrograph (on the SOAR telescope) | |
| Optical System for Imaging and low-Intermediate-Resolution Integrated Spectroscopy (on the Gran Telescopio Canarias) |
Data content keywords (Section §6 from article)
- Tag articles with relevant data content keywords from the UAT (Unified Astronomy Thesaurus).
Summary: Small tips for FAIR tables
- For tables containing known astronomical objects, an existing
non-altered name must be given along with the
coordinates.
- Important point: Tables of astronomical objects without coordinates cannot be added into the SIMBAD database.
- All columns must be explained with their corresponding unit.
- Your columns should be homogeneous, and you should avoid mixing measurements with different meanings: errors mixed with limits, or values with different units (that should be in different columns). One same unit per column in a table.
- When there is more than one table, the objects in common must be identified with the same name between tables.
Next chapters
In the next chapters, you will learn what are the different submission routes (depending on your journal) and then how to prepare and submit your data to VizieR. Ultimately you will see how to search your data using the EOSC tools.
Content from Submission routes and journals
Last updated on 2023-11-02 | Edit this page
Overview
Questions
- Where are the catalogues coming from?
- What to do with my data knowing my journal?
Objectives
- Describe the different submission routes per journal
Overview
The submission routes for your data vary depending where you submitted your paper.
2 types of VizieR workflows:
- Initiated by authors
- Initiated by the CDS
Interactive plot below: Scroll over to see the number of VizieR catalogues per journal (updated weekly).
American Astronomical Society Journals (AAS)
The CDS selects tables from published papers which will be ingested in VizieR. Machine readable tables (MRT) are prioritised, but other tables or FITS spectra/images can also be added.
List of journals included:
- The Astrophysical Journal: ApJ
- The Astrophysical Journal Supplement Series: ApJS
- The Astrophysical Journal Letters: ApJL
- The Astronomical Journal: AJ
Recommendations (from the AAS webpage):
The authors should try to prepare their lenghty tables as machine readable table (MRT) format. Then, VizieR harvests AAS Journal MRTs and makes these data discoverable and searchable via Virtual Observatory protocols, which is another benefit to using this data format.
Reference (from the AAS webpage):
Astronomy & Astrophysics (A&A)
Before publication, A&A editors decide which data will be only available at CDS (in VizieR). The authors then need to submit the requested data to CDS and the data will be available at CDS just after publcation of the paper. Other tables already published can also be selected by the CDS.
Recommendations (from the A&A webpage):
By contract with the Journal, the CDS archives the primary data that are published in A&A and puts them at the disposal of the global community.
Once their papers accepted, the authors submit their MRT files (if possible) directly to the CDS.
References (from the A&A webpage):
Monthly Notices of the Royal Astronomical Society (MNRAS)
CDS selection or direct authors submission depending on CDS acceptation.
Recommendations (from the MNRAS webpage):
Authors are encouraged to upload machine-readable versions of their tables on the VizieR database. Authors should consult the CDS website for instructions on preparing and submitting tabular data, which include a template that can be adapted for MNRAS tables. A hyperlink can be included to CDS from the electronic text of the MNRAS article.
References (from the MNRAS webpage):
Other journals
Any other journals needs the author to submit the data.
Examples of other journals included in VizieR, ordered by their percentage of catalogues ingested in VizieR:
- Publications of the Astronomical Society of the Pacific: PASP (0.85%)
- Pis’ma v Astronomicheskii Zhurnal: PAZh / AstL (0.73%)
- Astronomicheskii Zhurnal: AZh (0.66%)
- Acta Astronomica: AcA (0.58%)
- Publications of the Astronomical Society of Japan: PASJ (0.41%)
- Astronomische Nachrichten: AN (0.30%)
- Baltic Astronomy: BaltA (0.23%)
- Nature: Natur (0.10%)
- Science: Sci (0.08%)
- Research notes of the AAS: RNAAS (0.008%)
Large datasets / surveys
Very large catalogues are usually directly retrieved by VizieR (from ESA, ESO, NASA, Stsci, …), after selection by CDS astronomers.
Note that the CDS is not a mirror, and a selection on the columns can be done.
Type of big catalogues included (as listed on the VizieR hierarchical organisation webpage):
| Category | Type of data | Example of VizieR catalogue | Description |
|---|---|---|---|
| I | Astrometric Data | I/355 | Gaia DR3 Part 1. Main source (Gaia collaboration, 2022) |
| II | Photometric Data | II/328 | AllWISE Data Release (Cutri+, 2013) |
| III | Spectroscopic Data | III/283 | RAVE 6th data release (Steinmetz+, 2020) |
| IV | Cross-Identifications | IV/39 | TESS Input Catalog version 8.2 (TIC v8.2) (Paegert+, 2021) |
| V | Combined Data | V/154 | Sloan Digital Sky Surveys (SDSS), Release 16 (DR16) (Ahumada+, 2020) |
| VI | Miscellaneous | VI/135 | All-sky spectrally matched Tycho2 stars (Pickles+, 2010) |
| VII | Non-stellar Objects | VII/233 | The 2MASS Extended sources (IPAC/UMass, 2003-2006) |
| VIII | Radio and Far-IR data | VIII/65 | 1.4GHz NRAO VLA Sky Survey (NVSS) (Condon+, 1998) |
| IX | High-Energy Data | IX/68 | XMM-Newton Serendipitous Source Catalogue 4XMM-DR12 (Webb+, 2023) |
Summary: Submission per journal
2 types of VizieR workflows:
- Initiated by authors / editors
- Initiated by the CDS
To face an increasing volume and according to the CDS mission, VizieR selects the articles to be processed.
- Main journals origin : AAS (ApJ, ApJS, ApJL, AJ), A&A, MNRAS
- Authors asking for VizieR publication
- Scientific criteria such as the origin of the measurements (e.g. observations have a higher priority than models)
- Effort required to make the data reusable (preferably MRT) is taken into account in the selection
- Special case : A&A editors request authors to submit their data in CDS
Next chapters
In the next chapters, you will learn how to prepare and submit your data to VizieR step-by-step, and then you will follow the journey of your data in the Virtual Observatory and up to EOSC.
Content from Preparing your data
Last updated on 2023-09-11 | Edit this page
Overview
Questions
- What kind of data can be submitted to VizieR?
- Which formats are accepted?
- How can I test my FITS?
Objectives
- Define the type of data accepted in VizieR
- Prepare your data, integrating the FAIR principles
Overview
In order to facilitate the usability of the data, and to allow their processing by the data centers, we at CDS require that:
- the data are described accurately enough to allow an unambiguous interpretation of the data, as well as a comprehension of the context in which the data were acquired and/or processed; a single ascii file, named ReadMe, is designed for this role.
- the data are in a format which allows their usage by tools currently in usage in our discipline.
The following data types are accepted:
- Tables
- Associated data : images, spectra, SED, time series, cube
In this chapter, we will answer to some frequently asked questions about how to prepare the data for their inclusion in VizieR.
A full description of the standard conventions used for the documentation of the catalogues is available from there.

Tables
Tables are the main data types accepted. An example of ingested table is shown below.
The following formats are welcome:
Accepted format
In order of preference:
- Machine-Readable Tables (MRT
/ FORTRAN format)
- Not available yet through the VizieR submit interface
- TSV, CSV: TSV (tab-separated values) or CSV (comma-separated values)
files containing a first line with column description is accepted
- Comments (line beginning by #) are accepted but not transformed into MRT at the submission step
- ASCII aligned files
- Original ASCII format used in VizieR
- FITS table
- FITS containing only one HDU
- VOTable
- Standard XML output defined by the IVOA. VizieR allows to upload VOTable which contain a single table.
Note: zip and gzip compression are allowed. Archives should not contain directories.
The submit web application allows different formats for tables and helps you to ingest your data.
What cannot be used
Postscript or word/excel files.
Files containing different numbers of columns per rows.
Checklist when creating a table
- Present the appropriate number of significant figures for numerical measurements and uncertainties (cf. §2c ).
- An explanation is given for all the columns (at least a clear label and a short explanation; at best, complete explanation) (cf. §3.1).
- Units are given for all the columns (when relevant).
- One column is homogeneous, i.e. does not mix different measurements having different units or errors with limit values or flags.
- For tables with sources, give:
- It is really much better to stick to the same identifier from a table to another.
- If the measurements come from other papers, the references to those papers should be explicitly given using the bibcode.
- Use the same representation of missing data and have a separate field that explains the different reasons (cf. §3.1d) for missing values if needed.
More details on how to create FAIR tables can be found in the previous Chapter “FAIR principles for astronomical data”.
Following this checklist will help improving the efficiency of the ingestion in VizieR and also the visibility and reusability of your data :).
Associated data: images, spectra, time series, cube
In addition to the Tables, other data type are associated.
Reusable file formats for associated data:
Accepted format
| Product type | Accepted format |
|---|---|
| images (2-D data) | FITS |
| spectra, sed (1-D data) | FITS, VOTable, ASCII |
| time series | ASCII, FITS |
| cube | FITS |
Note: Although multiple formats are accepted, only FITS files will be indexed and accessible through the VizieR associated data service and through the Virtual Observatory. The other formats will still be accessible through the FTP.
General rules for FITS
In order to index FITS formats as accurately as possible, several basic meta-data are needed, usually readily provided by the telescope software and data processing pipelines such as IRAF and MIDAS, as FITS header keywords.
As a good practice, any FITS header should provide:
- WCS projections for positions and spectral data
- Standard FITS keywords described in the NASA FITS description.
List of important keywords to be included:
-
Positions
- target name
- coordinates: full WCS (World Coordinate System) is recommended including the projection, the center … (FITS cards: CRVAL, CDELT, CDi_j, CTYPE, CUNIT, CRPIX..)
-
Wavelength(s) of observations
- full WCS recommended including units (ex: IRAF WAT cards)
- Observation date
- Telescope: instrument and Facility
For the sake of clarity and simplicity, we ask the authors, whenever possible, to stick to the “1 item = 1 file” rule, i.e. 1 star spectrum per file, for instance. In this simplest context, fits files should ideally also have only 1 HDU.
File naming conventions
According to ISO 9660 standard, filenames are written as name.extension, with at most 8 characters for name and 3 characters for extension as detailed below:
- 8 alphanumeric characters, plus the minus sign and the underscore,
are allowed ([a-z0-9_-])
- For files corresponding to published material, the names are consistent with the published paper, and we use tablen.extension to refer to the table numbered n in the published paper, fign.extension for the figure numbered n, etc.
- Followed by a dot
- And an extension made of 3 characters related to the format of the
files, following the conventions:
- .dat for data files,
- .fit for FITS files,
- .tex for TeX/LaTeX files,
- and .txt for text files (ascii files containing only printable text).
Full details about the files and directories structures can be found in the Adopted Standards for Catalogues document.
Quiz: Are these filenames correct or not?
Q1) ‘TABLE998.dat’
Q2) ‘table.4.long.version.dat’
Q3) ‘table.dat’
Q4) ‘test+table.dat’
Q5) ‘my_table.data’
Q6) ‘table&data.dat’
Q7) ‘myfile.jpg’
R1) No: filenames should be in lowercase.
R2) No: filename too long. This filename will be shortened afterwards anyway.
R3) Yes: correct. Although not very self-explanatory.
R4) No: ‘+’ character not supported.
R5) No: data files are represented as ‘.dat’.
R6) No: ‘&’ character not supported.
R7) No: File type not accepted.
VizieR FITS validator
You can test your FITS spectra/images with the VizieR FITS validator tool which evaluates the compatibility between your FITS and the asked meta-data.
This meta-data checking is also completed during the VizieR submission service.
Interactive window: VizieR FITS validator tool webpage. Note that you can test your FITS directly (it is not an image).
Summary: Type of data accepted by VizieR
Data types accepted:
- Tables (including at least a ReadMe file)
- Associated data : images, spectra, SED, time series, cube
Preferred formats:
- Tables should be preferably written as machine-readable tables (MRT).
- For the associated data, the FITS format is the preferred solution.
Do not forget to test your FITS data before submission with the VizieR FITS validator tool.
Next chapters
In the next chapters, you will learn how to submit your data to VizieR, and finally how to search your data using the EOSC tools.
Content from Submitting astronomical data
Last updated on 2023-10-31 | Edit this page
Overview
Questions
- Who need to submit their data?
- How and where to submit your data?
- What is a ReadMe file?
- Do and don’t when submitting data
Objectives
- Fill a ReadMe file
- Submit your data in the existing and new Open Science systems, keeping in mind the Virtual Observatory (VO) standards
Overview
In the following Chapter, we detail the data submission part which happens after the acceptance / publication phase.
Not everybody needs to send their data to CDS! We invite you to read carefully the next sections to understand your next steps.

Who need to submit their data?
If your article does not contain any tables, you can skip the following!
Otherwise, the following checklist summarizes what to do.
More information on the submission routes per journal are available in the Chapter “Submission routes and journals”.
Where to deposit the data?
Two routes are possible to submit your data to VizieR:
- Option 1: If not too bulky, use the submission online
interface
- The upload will generate a ReadMe skeleton file based on
your tables and perform a few basic checks.
- You will need to check and complete this ReadMe file.
- Alternatively, if you already have created a ReadMe file, you can upload it directly along with your tables.
- In addition to your table, FITS files (spectra or images) for associated data can be uploaded.
- The upload will generate a ReadMe skeleton file based on
your tables and perform a few basic checks.
- Option 2: Use the File Transfer Protocol
(FTP)
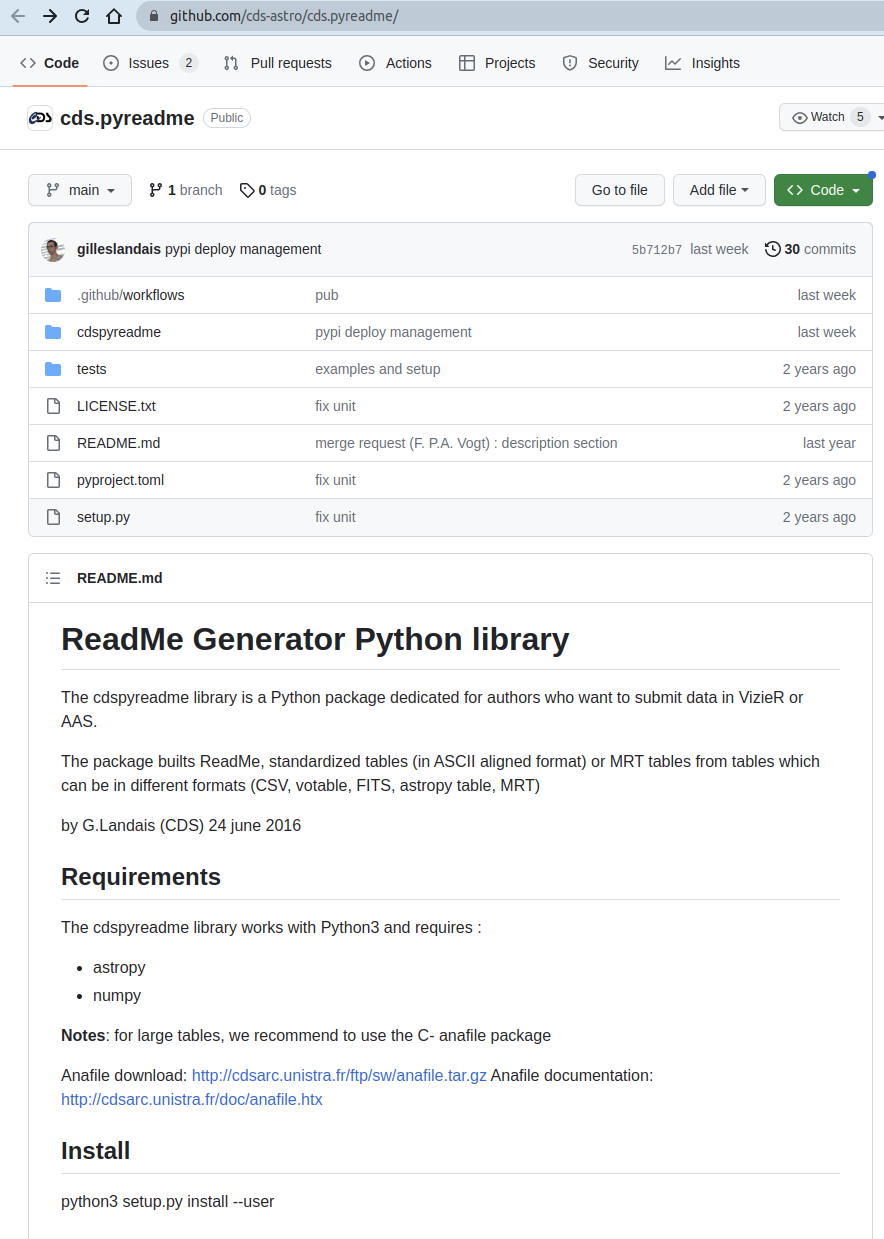
- You can use the Python cdspyreadme library to create the required ReadMe file.
- Tables and other data (not necessarily FITS) can be uploaded. More information on the data types accepted are available in the previous Chapter “Preparing your data”.
For larger files or any other questions, please contact the VizieR staff: cds-cats(at)unistra.fr .
ReadMe file
The why and what of the ReadMe file
To be reusable, any data needs extra information. In astronomy, the convention is to give this information (authors, title, references, summary, etc…) in a separate file called ReadMe.
Every catalogue in the Virtual Observatory registry has its own ReadMe. Numerous examples can be found on the FTP directories at CDS. A typical illustration could be e.g. J/A+A/382/389/ReadMe.
Here is an example of a ReadMe skeleton:
Reference             Short Title                                (Author+, Year)
================================================================================
Title of the paper
    Authors
   <Reference (200Y)>
   =20YYjjjjjvvvvLppppA
================================================================================
ADC_Keywords:
Keywords:

Abstract:
Description:

Objects:
    -----------------------------------------
       RA   (2000)   DE    Designation(s)
    -----------------------------------------

File Summary:
--------------------------------------------------------------------------------
 FileName Lrecl  Records  Explanations
--------------------------------------------------------------------------------
ReadMe       80        .  This file
table.dat    28      120


Description of file:    [if needed]

See also:

Byte-by-byte Description of file: table.dat
--------------------------------------------------------------------------------
   Bytes Format Units   Label     Explanations
--------------------------------------------------------------------------------
   1-  8   A8    --- col_0 ? [ 0123456CGMN]
  10- 14   F5.2  --- col_1 ?
  16- 21   F6.2  --- col_2 ?
  23- 27   F5.2  --- col_3 ?


Acknowledgements:

References:

================================================================================
How to generate the ReadMe file?
There are two recommended ways to generate your own ReadMe file:
- With the submission online
interface:
- The upload table process generates a ReadMe skeleton and the standardized tables; both are required for VizieR.
- This ReadMe file can then be edited or you can upload your own file.
- With the cdspydreadme
Python library:
- This package builds ReadMe, standardized tables (in ASCII
aligned format) or MRT tables from tables which can be in different
formats (
CSV,votable,FITS,astropy.Tables, orMRTformats). - The whole ReadMe can then be tested with the command line tool anafile.
- This package builds ReadMe, standardized tables (in ASCII
aligned format) or MRT tables from tables which can be in different
formats (
How to fill the ReadMe file
The Standards for Astronomical Catalogues gives a complete description of the standard for ReadMe files.
In the following we give some tips on how to fill three different sections of the ReadMe file properly. The rest of the ReadMe will be filled by CDS, and thus does not appear below.
The ReadMe file in more depth
General comment: no line in this description file can exceed 80 characters!
It is moreover suggested to limit the textual parts to 70 characters, such that a conversion to FITS could keep the text as COMMENT cards.
- Title of the paper: Title as written in paper
- Authors: List of authors or collaboration
- Reference: If available (bibcode), otherwise the article number
-
Abstract: Describes the scientific results
that the author(s) derived from the data.
- It is simply the one from your refereed paper.
-
Description: Gives the context of the
data, such as instrumentation or observing conditions.
- It should answer the following questions: what, where, when, how.
This section describes the structure of each data files (files with the .dat extension). This description is made in a tabular form, each row describing one field (column) of the data file.
The description is presented as a five-column table with the following elements:
- the starting (from 1) and ending byte of column, separated by a dash -; this dash is however not required for a single-byte column.
- the format of the field, written as a fortran-like
format
- An for a character column made of n characters;
- In for a column containing an integer number of n digits;
- Fn.d for a column containing a float number of width n digits and up to d digits in the fractional part;
- En.d for a number using the exponential notation;
- the units used in the field. SI units are strongly encouraged, avoid the CGS units (for instance, use mW/m2 instead of ergs/s/cm2).
- the label (heading) of the field, made of a single word (no embedded blank); a few basic conventions are used for usual parameters (e.g. positions) and related quantities (e.g. mean errors).
- a short explanations of the contents of the column. This last field may also specify: the available range of the value in the column (using […]), the possibility of having unspecified or NULL values (using ?), the order of the values within the table (increasing or decreasing order). More details can be found here.
The CDS can help you to fill a part of the byte-by-byte description (bytes, format, label), but it is crucial that you fill the units and explanations columns.
Data submission (option 1): Online interface
The first option is to use the online interface available at: https://cdsarc.cds.unistra.fr/vizier.submit/.
This web application enables the upload of the data and invites you to fill a ReadMe file generated by the application. The VizieR upload application will create a TEMPORARY repository containing your tables, associated files (spectra, images, cubes) if any, and the ReadMe file.
However, even after completing all steps, your catalogue will not be readily available in VizieR. Additional work by the VizieR team is needed, including checks and homogenization to our standards, before the catalogue is fully ingested.
In the following, we show how to upload your data step-by-step. Additional information on how to use this service can be found on the VizieR catalogue upload (HELP) page.
Start a session
No account creation is needed. One just needs to choose a login for the session, eg. my_unique_id_2023. The login can be reused until the completion of the process but not after submission.
Note - 1: Your login is tight to a given IP address.
Note - 2: Please contact the VizieR staff: cds-cats(at)unistra.fr if a modification to a recently submitted upload is needed.
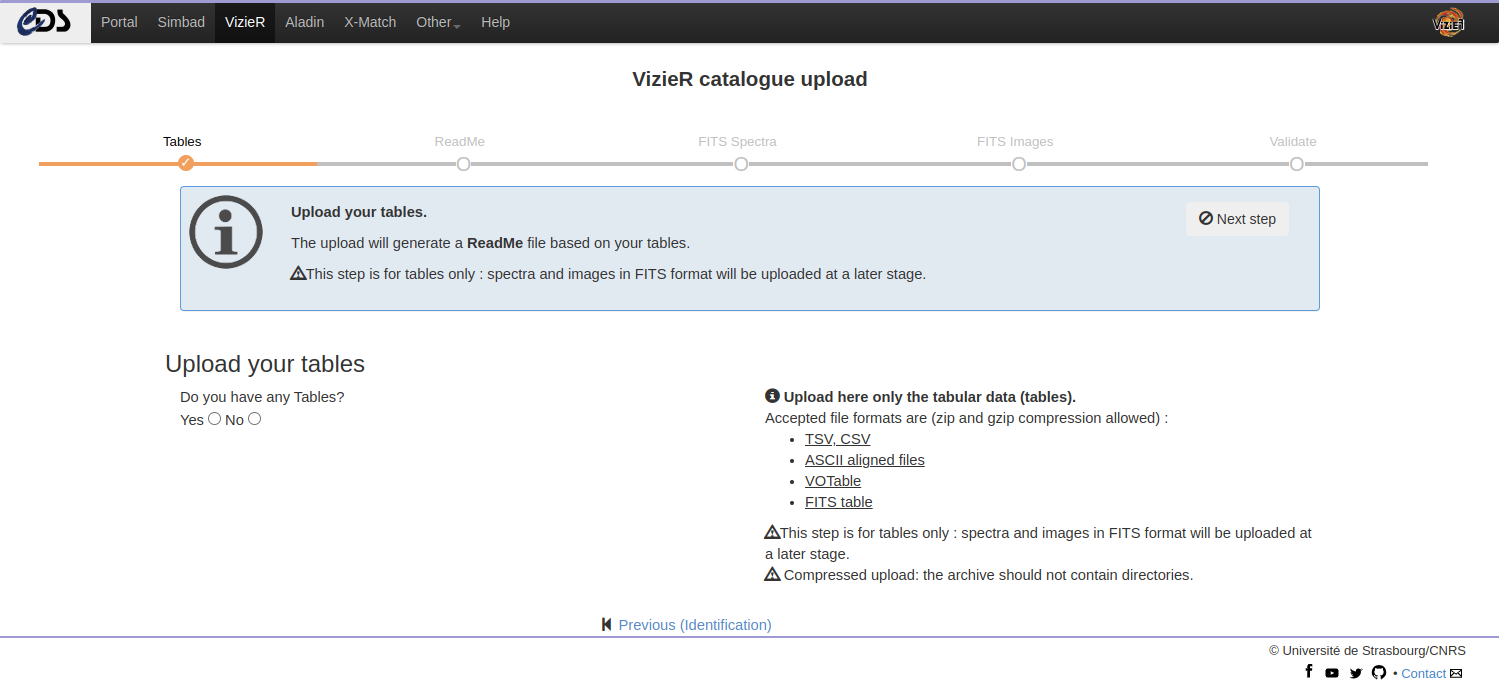
Interactive window: VizieR catalogue upload webpage. Note that it is not an image, you can submit your files directly from here.
Upload tables
The VizieR submit service detects automatically the input format. Please, upload here only the regular tabular data (tables). More information on the accepted formats can be found in the Chapter “Preparing your data”.
The upload will generate:
- a ReadMe skeleton including the byte-by-byte based on your uploaded tables
- ASCII tables with aligned columns (FORTRAN Format / MRT (Machine Readable Table))
Note: Check that all the tables are uploaded at this stage. Adding tables later implies to remove all tables and ReadMe.
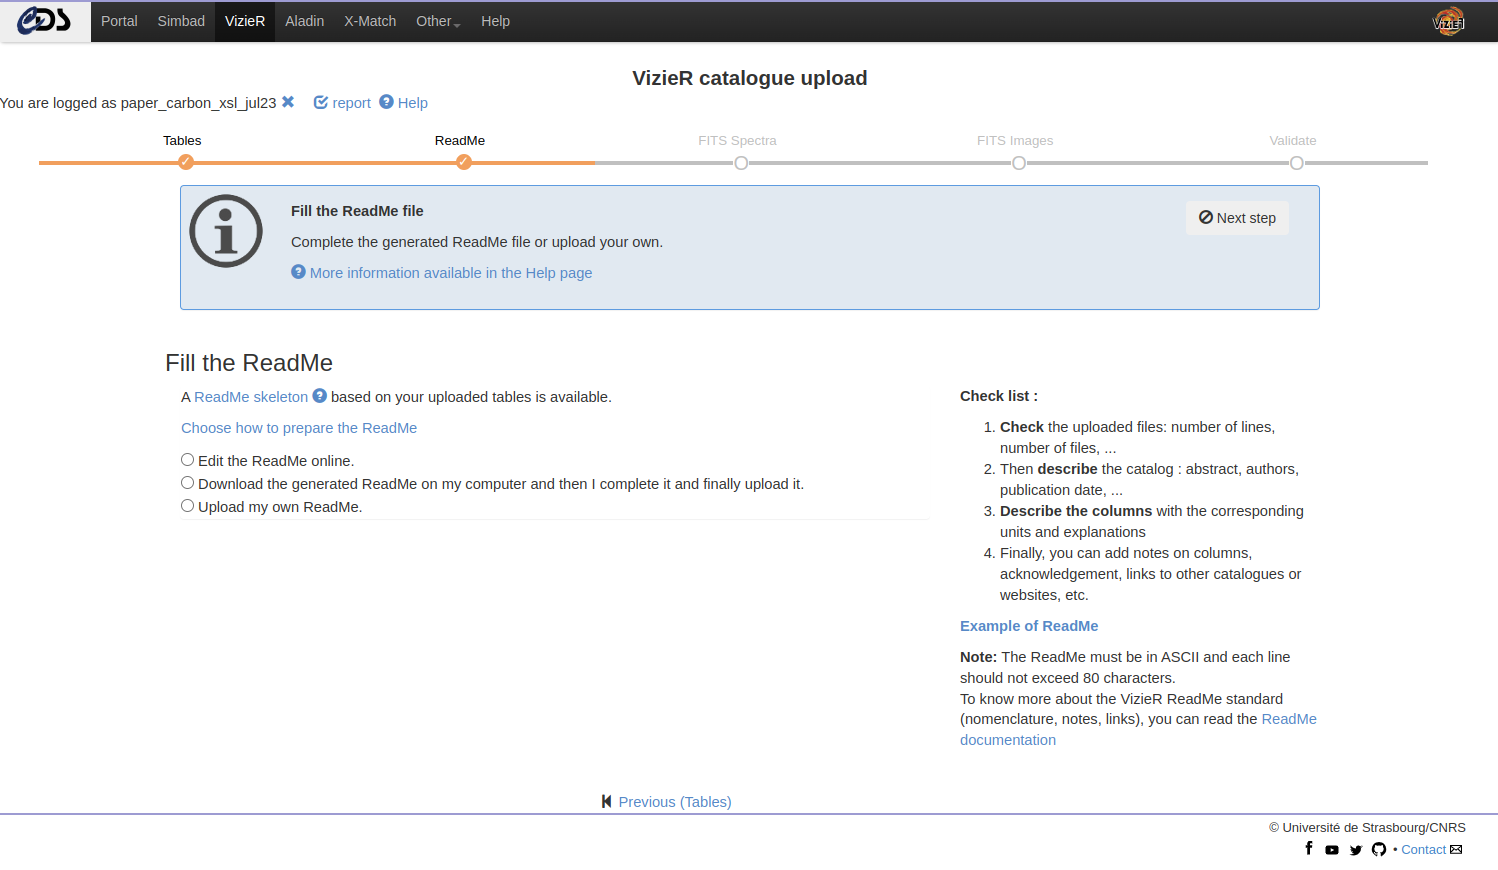
Fill the ReadMe
Once the tables uploaded, the next step is to fill the ReadMe file. You can:
- Edit online
- Download and complete locally
- Upload your own ReadMe
Then you submit the updated ReadMe with the “upload” button:
- This action will check the consistency between the ReadMe and your files.
- The page is refreshed and a report is displayed. This output is the result of the anafile package - see next section.
- In case of error, the CDS recommends to review the ReadMe (and remove the ReadMe).
- But, even if you encountered problems, you can still go to the next step.
Note - 1: The online mode makes regular backups. You can restore the last version and force the backup.
Note - 2: Check that all the tables are uploaded at this stage. Adding tables later implies to remove all tables and ReadMe.
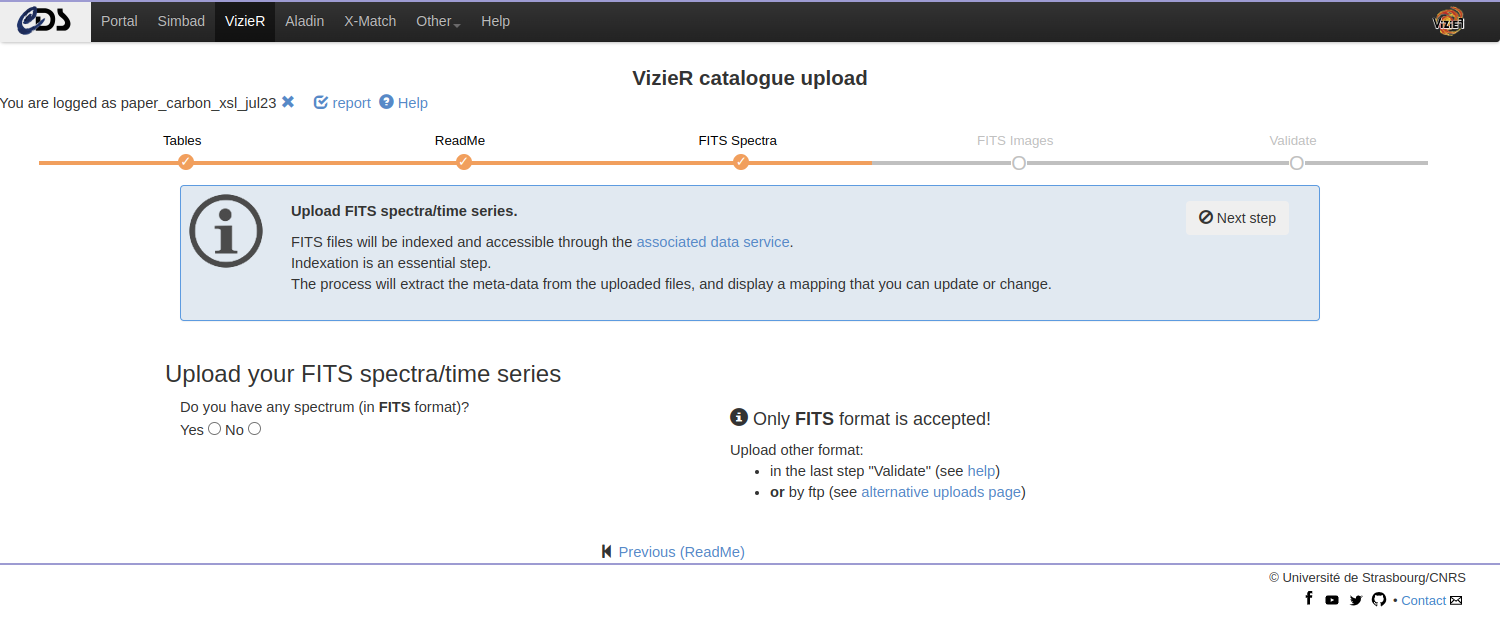
Upload FITS Spectra / Time series
Once the tables and the ReadMe are uploaded, you can upload your associated data: spectra and time series. More information on the accepted formats can be found in the Chapter “Preparing your data”.
The FITS upload generates a mapping between the spectra FITS header and ObsCore keywords. We strongly encourage you to modify the mapping to better describe your data.
Note: Although multiple formats are accepted, only FITS files will be indexed and accessible through the VizieR associated data service and through the Virtual Observatory. The other formats will still be accessible through the FTP.
The uploaded files can be of the following:
- a single FITS file (possibly compressed)
- a collection of independent FITS files gathered into an archive
(.tar)
- Independent means that headers are not similar and each FITS needs a dedicated mapping
- a collection of similar FITS files gathered into an archive (.tar)
- In that case, we make a unique mapping to describe all resources in the archive (.tar). Be careful, this option is available only if FITS have similar headers.
For each upload, a report is available. It is recommended to verify the mapping by clicking on the report header.
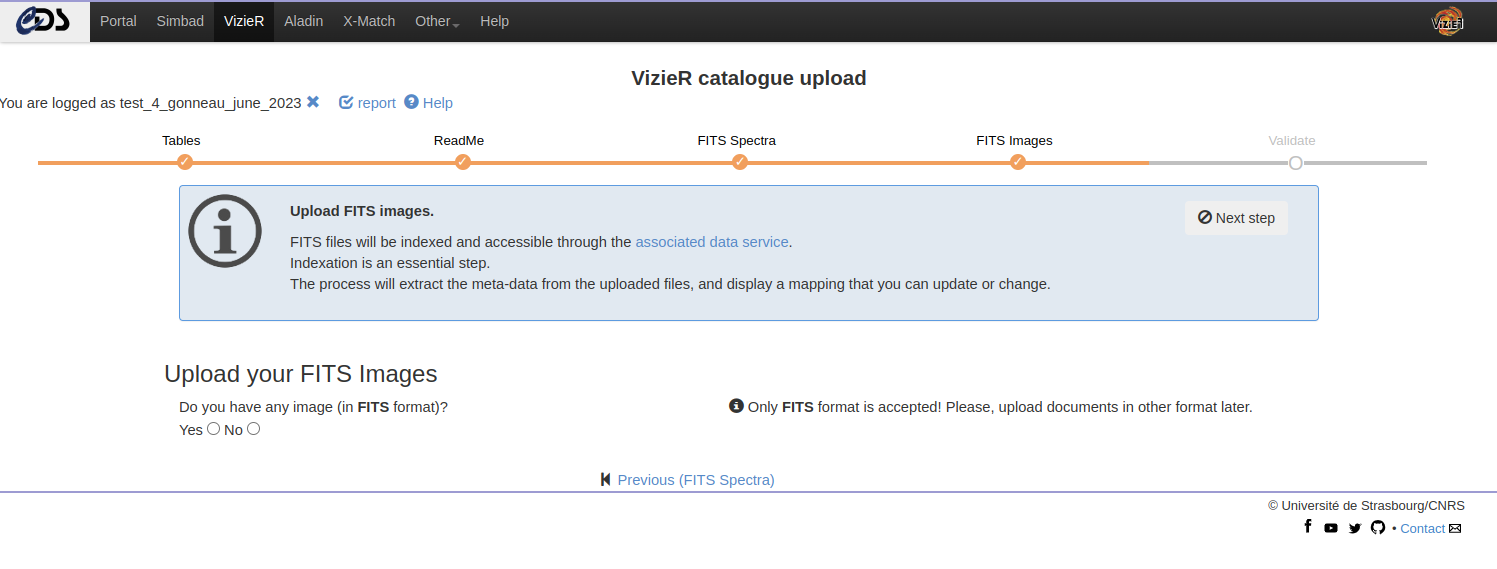
Upload FITS images
FITS images can also be uploaded in a similar way as the FITS Spectra (see above).
More information on the accepted formats can be found in the Chapter “Preparing your data”.
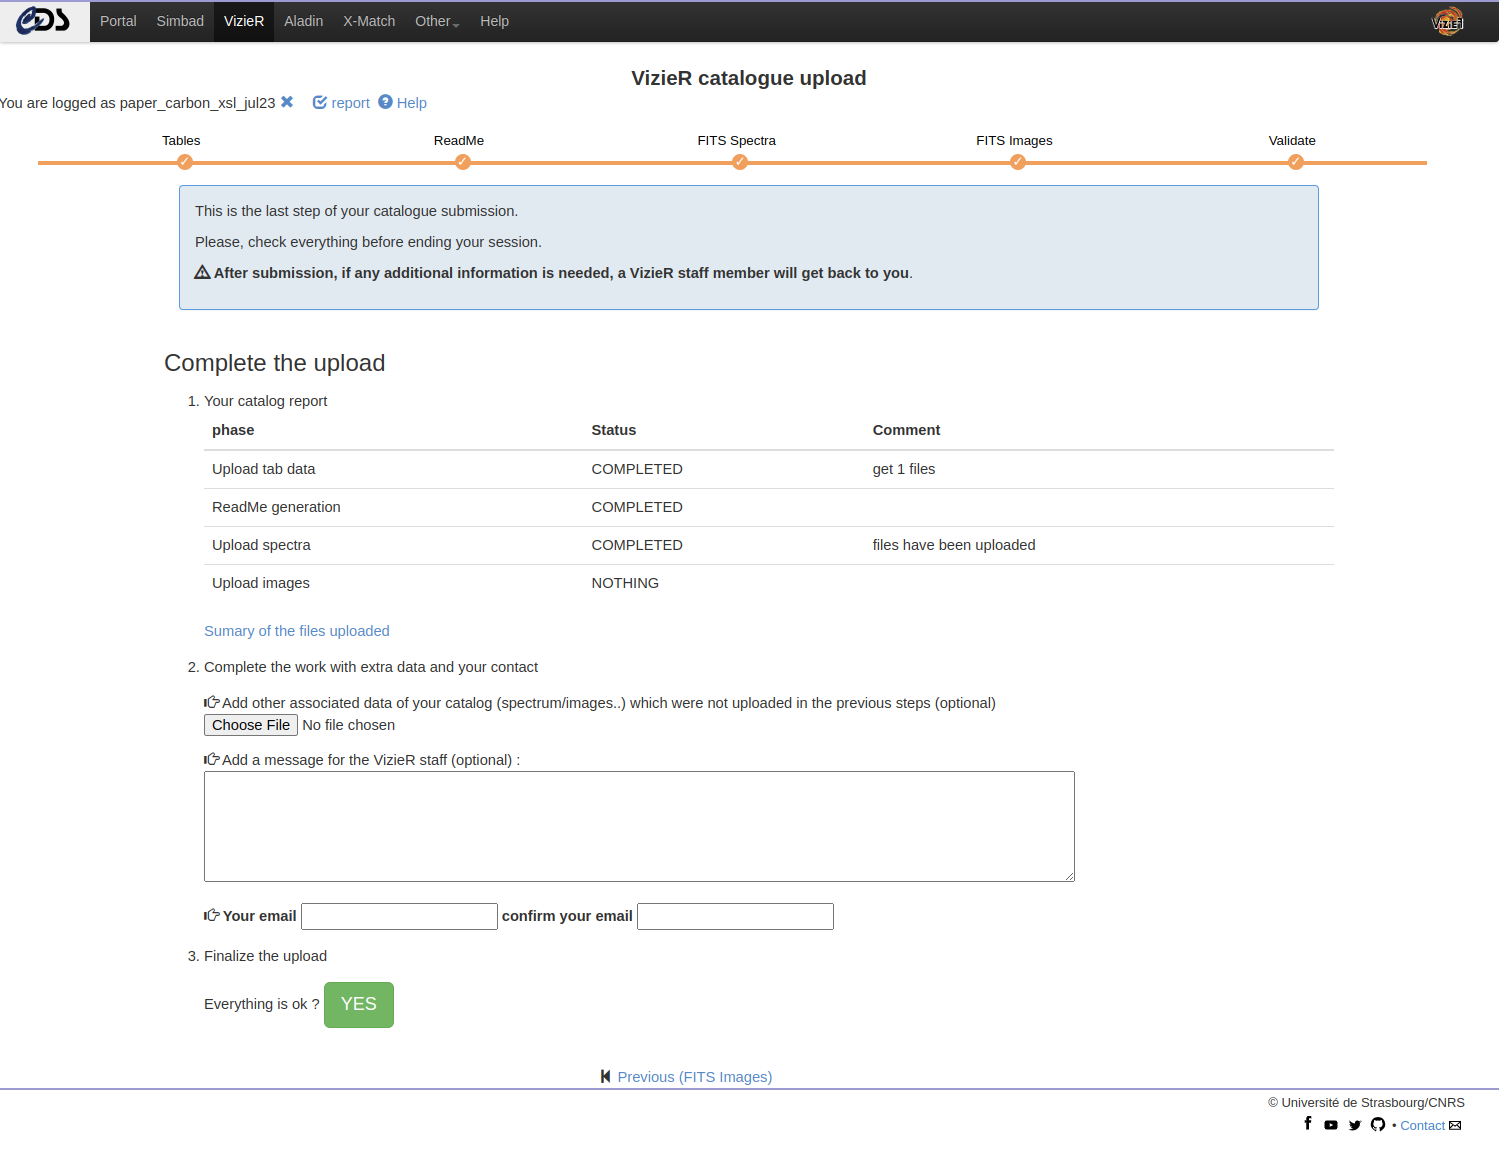
Terminate
This is the last step of your catalogue submission.
Please, verify that everything is correct before ending your session. Note that you can go back to the current work using the same login until you have submitted this page with the “Yes” button at the end of the page.
IMPORTANT POINT: A summary of the files uploaded is available via a temporary link, but DO NOT USE this url as it will disappear after publication.
In the last step you can:
- Upload additional files (keeping in mind the accepted formats)
- Add a message to the VizieR staff
Providing an email address is required at that stage. The email will be used if additional information is needed.
Note: If a modification to a recently uploaded is needed, please contact the VizieR staff: cds-cats(at)unistra.fr.
Data submission (option 2): File Transfer Protocol
An other option is to submit your data through File Transfer Protocol. This option is particularly recommended if the ReadMe file was created using the Python cdspyreadme library and for large files.
Since October 2021, FTP uploads requires a login authentification. A web application is available for authors to obtain a temporary login/password: https://cds.unistra.fr/ftp/token/. It includes some FTP instructions.
VizieR FTP token generation webpage. Note that it is not an image, you can already generate a temporary login.
Generate a temporary FTP login
The first step is to register to get a temporary login: available for 3 days.
To do so, the authors need to provide their email address (e.g. jane.doe(at)astro.fr) and choose a login (e.g. paper_carbon_jdoe_jul23). This unique FTP login (6 characters at least) will be dedicated for the upload of a single catalogue.
On success, a mail is sent to your email address with the FTP login and some instructions.
Upload to the CDS repository
Your freshly created account is ready and available for 3 days. You can put your files directly under the repository (the root ftp directory being dedicated per login).
More information on the accepted data and formats can be found in the Chapter “Preparing your data”.
Type the following command in a terminal to access the FTP server:
ftp ftp.cds.unistra.fr.
OUTPUT
Connected to ftp.cds.unistra.fr.
220 Welcome to the CDS FTP service.
Name: paper_carbon_jdoe_jul23
331 Please specify the password.
Password:
230-------------------------------------------------------
230-CDS FTP repository for authors
230-
230- => temporary directoy for user paper_carbon_jdoe_jul23
230-
230-Note for binary upload:
230-tape "bin" in prompt command to switch in binary mode
230-
230-ftp> bin
230-
230-(create Thu Jul  6 12:09:25 2023)
230-------------------------------------------------------
230 Login successful.
Remote system type is UNIX.
Using binary mode to transfer files.
ftp>
How to upload a table?
To upload a table (e.g. table.dat), use the command:
put table.dat.
OUTPUT
ftp> put table.dat
local: table.dat remote: table.dat
200 PORT command successful. Consider using PASV.
Switching to binary mode
In case of Binary data, make sure that your session in in binary
mode. This option, is not set by all FTP client - To force binary mode,
use the command bin FTP protocol as follow.
OUTPUT
ftp> bin
200 Switching to Binary mode.
Passive mode
By accessing the FTP server in passive mode –
ftp -p ftp.cds.unistra.fr –, one can get the directory
listing using ls.
OUTPUT
ftp> ls
227 Entering Passive Mode (130,79,128,14,36,87).
150 Here comes the directory listing.
-rw-r--r--    1 115      120          1570 Jul 06 14:08 ReadMe.txt
-rw-r--r--    1 115      120        259200 Jul 06 14:09 spectra_test.fit
-rw-r--r--    1 115      120             0 Jul 06 14:02 table.dat
226 Directory send OK.
Notify the VizieR team
Once you are done uploading your data (ReadMe, tables and any other associated data), you need to SEND AN E-MAIL to the VizieR team telling them where you have placed files: cds-cats(at)unistra.fr.
Summary: Data submission
2 options for data submission:
- Online interface
- File Transfer Protocol
The CDS provides tools to build ReadMe file and aligned ASCII tables (Machine Readable Table in FORTRAN format).
- No need to build it from scratch!
The ReadMe file describe your tables by providing all necessary information to locate the catalogue (authors, title, abstract, keywords, acknowledgments, …).
- This highly standardised file allows reusability and cross matching between catalogues.
- A good description of your data is the key to discoverability.
Next chapters
In the next chapters, you will learn what happen to your submitted data before their full ingestion into VizieR and the rest of their journey into the Virtual Observatory and up to EOSC.
Content from Data curation at CDS
Last updated on 2023-11-06 | Edit this page
Overview
Questions
- What happens to your data after submission to VizieR?
- What is the data curation?
Objectives
- Create FAIR tables, integrating “key” columns
- Summarize all the steps happening behind the curtains once your data are submitted, and before their full integration into the VO
Overview
Once the data have been submitted on the CDS servers, the VizieR team will check that the data are compatible with standards. Once the data have been accepted, the CDS team will also add some valuable and relevant information such as metadata and links to other catalogues. This can lead to interactions with the authors, but we are trying to minimize the level of interaction.

Behind the scenes: verifications
In addition to the semi-automated verifications already done by the programs during the different steps of the ingestion, more in-depth verifications are done by the CDS team focusing on the reliability and the quality of the catalogues.
Important points to check
In the following, we present some corrections applied to real datasets.
Here are the 5 important points that would save us some time:
- Units
- Parameters description
- Coordinates
- Identifiers
- Common key between tables
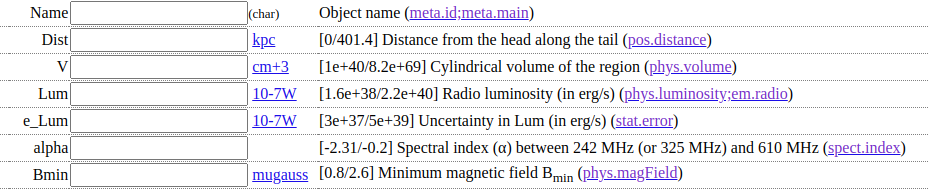
Verifications: Example 1 - Units
One key point is to the check the units.
Units corrected
In the example below the original unit for a cylindrical volume of a region (column Size from the figure below) was wrongly set to cm-3.
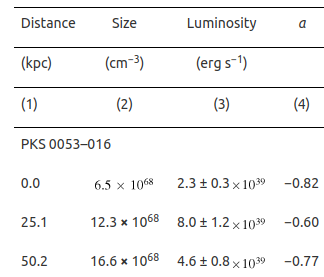
Our team picked it up and wrote to the author and made the description and unit correction (field V from the figure below).
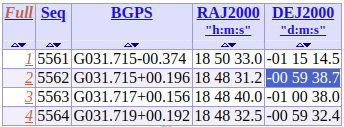
Verifications: Example 2 - Coordinates
After the units, the coordinates are the most important data the VizieR team try to gather and curate. It is indeed the most common way to search for data in VizieR.
Coordinates corrected
Here is an example of coordinates with discrepancies when the declination is at 0 degree.
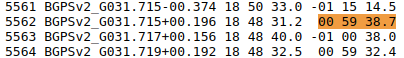
Once the error detected by our team (missing minus sign for some Declinations), the positions were then updated, two years after the data ingestion in VizieR.
When there are none, positions can be added from other catalogues or from SIMBAD if available. Alternatively, we ask for them (sometimes we have an answer).
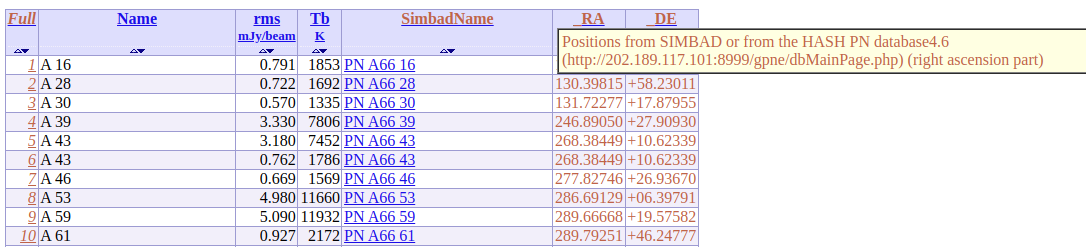
Coordinates added
In the following example, we can see that no coordinate was provided in the original table.
Using SIMBAD or otherwise the HASH PN databases (when no SIMBAD corresponding match has been found – SimbadName empty), we were able to complement this table with positions.
Verifications: Example 3 - Identifiers
The third important thing for our team are the identifiers.
SIMBAD names added + misprint on names corrected
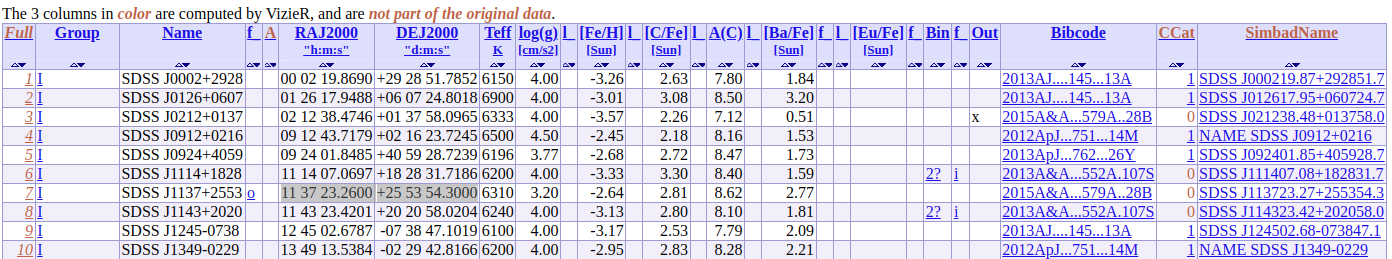
To retrieve coordinates and easy the cross identification between SIMBAD and VizieR, a proper identification is needed.
Here is an example of truncated SDSS names… Impossible to retrieve except by coordinates that we luckily have in this case.
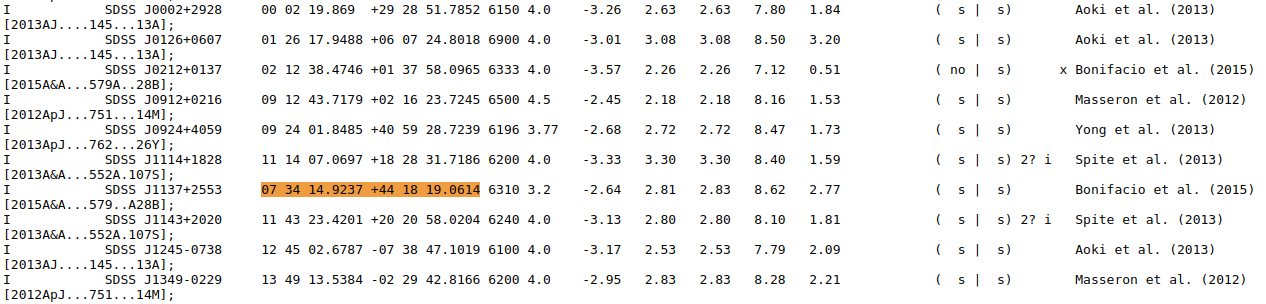
So the SimbadName has been added after the process for SIMBAD where misprints on coordinates have been detected (identified by the column f_Name set to o below for Name = SDSS J1137+2553, and highlighted in both figures Before/After). For this object with coordinates pointing to nothing, the right ones have been found thanks to the bibcode given in the table.
Verifications: Example 4 - Odd values
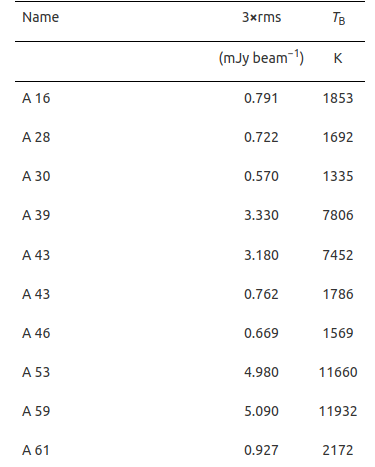
We add mimimum and maximum values of numerical columns. It allows us to detect some oddities and it is helpful also for the astronomer who will validate the VizieR catalogue afterwards.
Min-max values added
Verifications: Example 5 - Link between tables
We also add links between tables in VizieR. For instance, if an author said that magnitudes come from a certain survey, we actually point to that survey so we can verify the values. If a table contains galaxy clusters and another the membership, we can add the number of galaxy members per cluster, assuming the cluster names are the same in both tables.
Adding those links helps us to detect errors and missing data.
Link between tables added
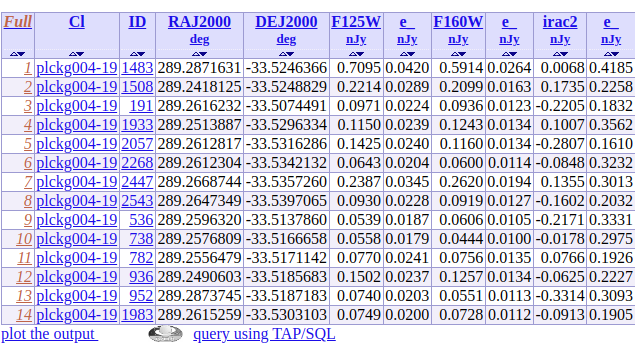
In the example below, the column Nz (Number of high-z galaxies in a given cluster) has been added to the original Table 1 to create a link with the relics-z table.
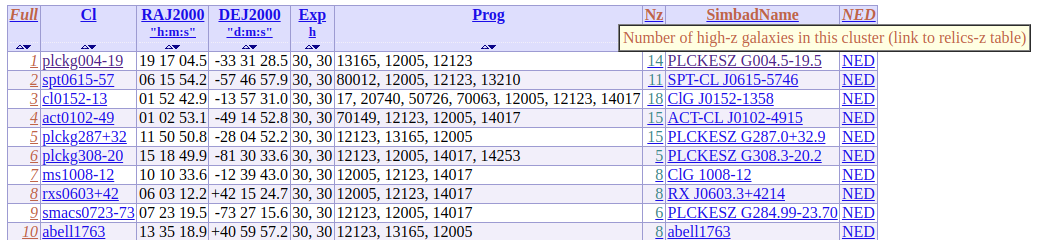
By clicking on the value “14” from the column Nz for the cluster “plckg004-19”, one will get automatically the corresponding rows from the relics-z table, without any extra filtering, as illustrated below.
Verifications: Example 6 - Missing common key
Last but not least, to add links between tables we need a common key (e.g identifier, coordinates …).
Cross-identification between tables
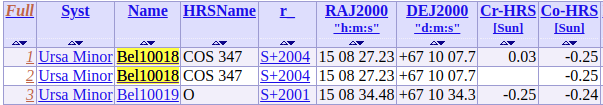
In the two figures below, we can see an example taken from a paper with two tables (Tables A and B) with two similar first columns in both:
- Name of the stellar system to which the star belongs
- Name of the star
However, it is not obvious that Bel10018 (SimbadName: [BFO2002] UMi 10018) mentionned in Table A corresponds to COS 347 in Table B.
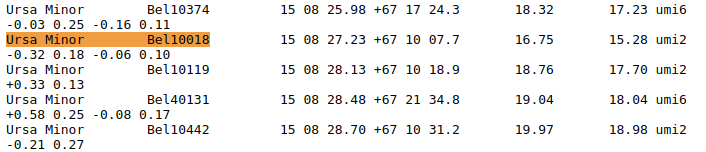
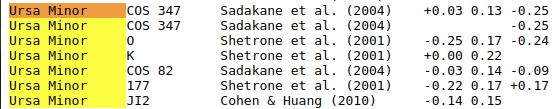
As there are no common identifier or coordinates repeated in the second table, the only alternative would have been to go through the list of references cited (3rd column of Table B) to get the coordinates and identify the object one by one. Therefore, the CDS team contacted the author to get the names and positions for Table B and create a better link between the two tables as displayed below.
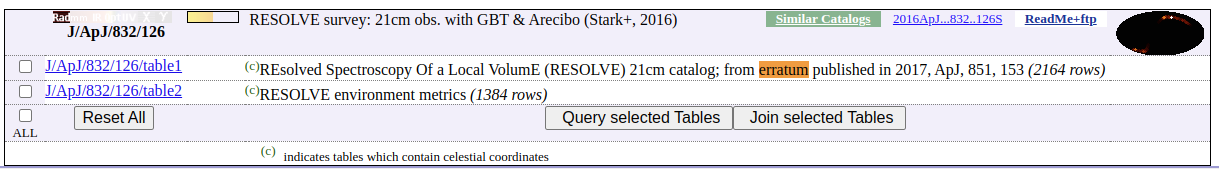
Errata
As said before, the VizieR database is evolving every day: with new catalogues being added or old ones being updated.
Tables updated
In the example below, one table from the original catalogue was updated, to reflect the changes published in an erratum.
Data available to all
Once the data are public, they are accessible as plain files in FTP directories at CDS and other participating data centers (e.g. at CfA/Harvard (USA) or NOAJ/ADAC (Japan)), as well as all VO compatible services.

Summary: What happens to your data at CDS?
Once the catalogues are submitted, a delay is needed for VizieR curation and validation before full ingestion!
The validation process involves some:
- Verifications leading to corrections: ~ 30% of the references
- Main corrections: identifiers, coordinates, units …
You cannot Find, Access and Re-use data if the coordinates/identifiers are not right!
Next chapters
In the next chapters, you will learn what happen to your fully ingested data when they continue their journey into the Virtual Observatory and up to EOSC.
Content from Journey of your data in the VO and EOSC
Last updated on 2023-09-07 | Edit this page
Overview
Questions
- What happens to your data after their ingestion in VizieR?
- Why publish to EOSC / VO?
- How do you find your data in EOSC?
Objectives
- Describe the integration of astronomy data services in the VO and EOSC
- Naviguate through the EOSC portal
From VizieR to EOSC
In the previous chapters, we concentrated on the publication of data via the CDS VizieR service. We will now show how the process leads to the data being made visible in the EOSC Portal. We invite astronomy researchers to follow the journey of their data to EOSC!
Once your data have been successfully ingested into VizieR, they begin their journey into the Virtual Observatory, as illustrated in the figure below.

Work within the ESCAPE project and the EOSC Future project has been aimed at connecting the existing astronomy data publishing systems to the European Open Science Cloud (EOSC).
The first stop for your data after VizieR is the International Virtual Observatory Alliance (IVOA) registry. It gathers the data from ViZieR, and other astronomical data centers.
Then the datasets reach a broader audience when EUDAT/B2Find and the EOSC registries gather information (harvest) about everything emitted by the IVOA registry. In this way the familiar processes of publishing data become part of the wider EOSC system.
The European Open Science Cloud (EOSC)
EOSC is the European web of FAIR data and related services for research. It stands for European Open Science Cloud and it aims to make research data easy to find, access, interoperate and reuse (FAIR), making trusted and sustainable research outputs available within and across scientific disciplines.
The EOSC ambition is to federate existing data, research and e-infrastructures to make them all available to European researchers across borders and across disciplines.
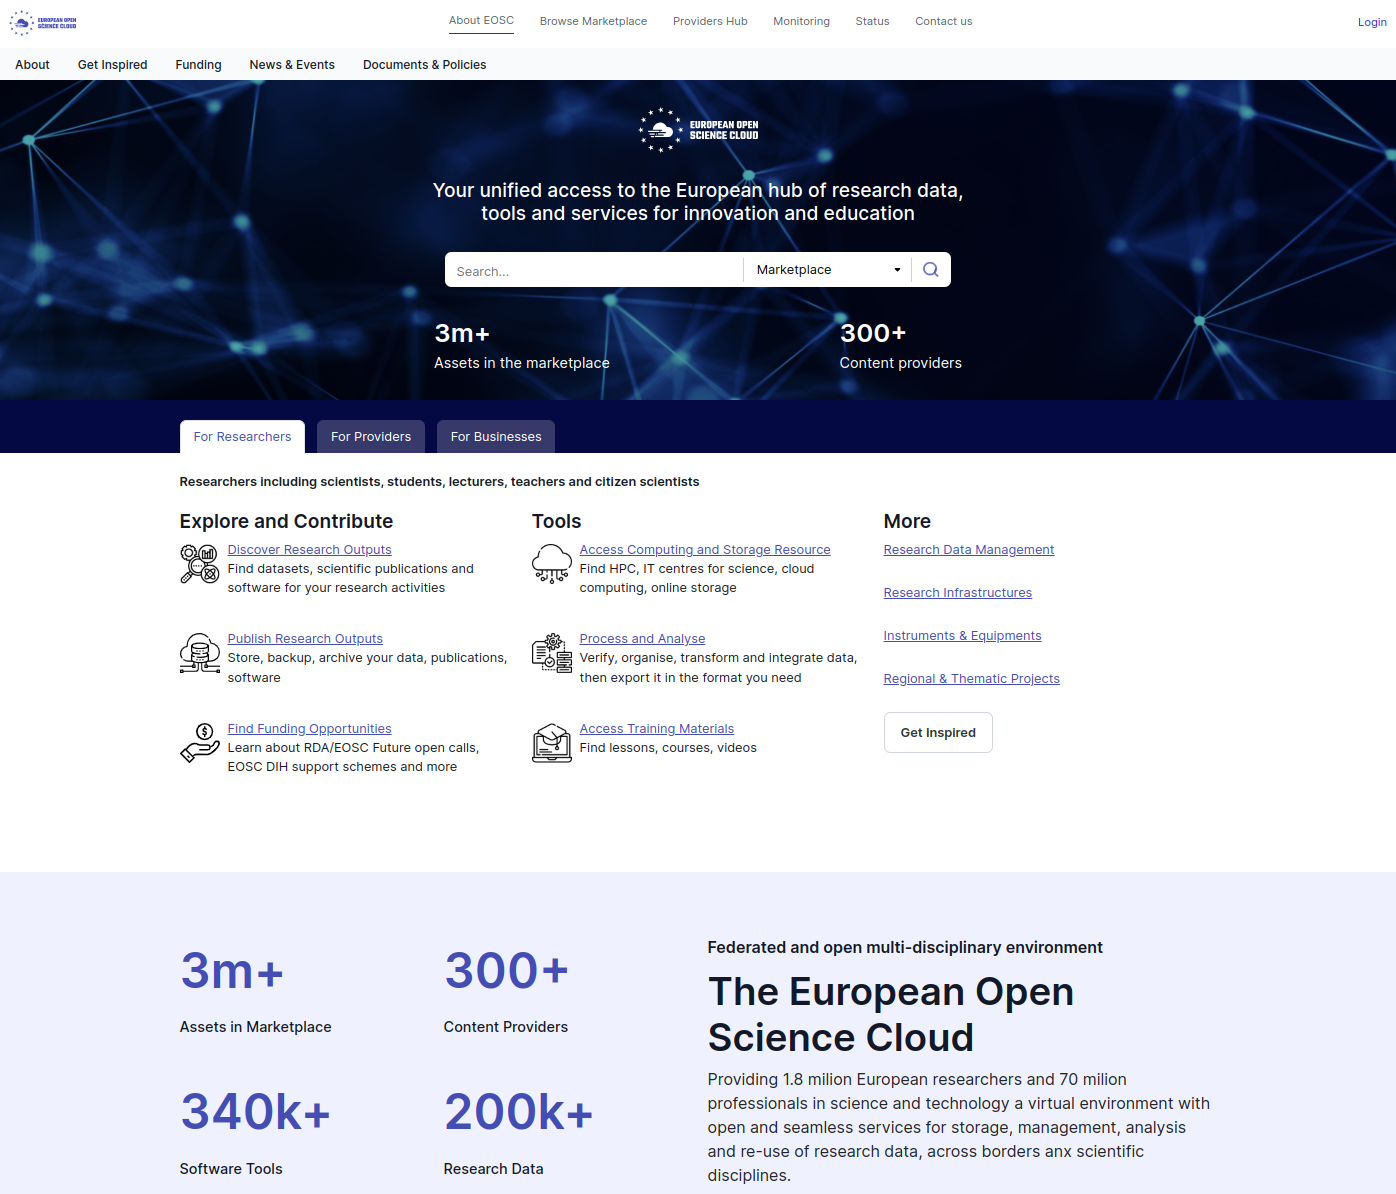
EOSC Portal
The EOSC Portal is one of the results of the EOSC Future, European Commission funded project (2019-2023). It provides an interface to EOSC for researchers to utilise the full spectrum of EOSC resources, which include research publications, data, software, and value-added services to support their research.
For prospective users of the services, the Portal provides training materials and tutorials on how to use its features. The Portal also offers information for potential service providers on how to onboard their services to the EOSC Portal Catalogue & Marketplace.
Case Study: Gaia DR3
In the following, we will show how to find your data in EOSC, using Gaia DR3 (VizieR DOI: 10.26093/cds/vizier.1355) as an example.
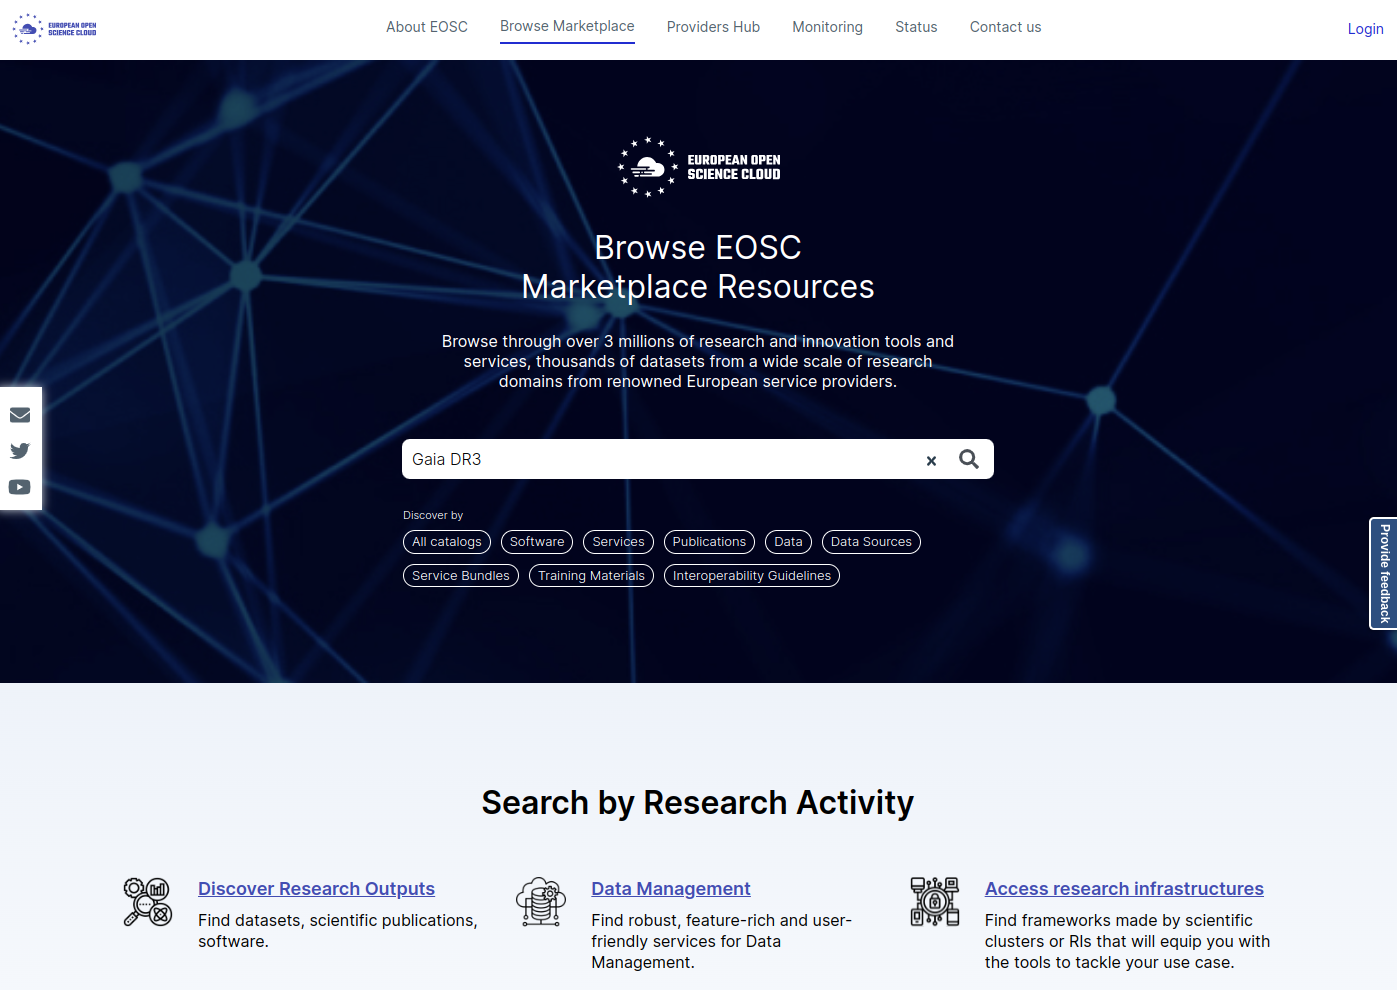
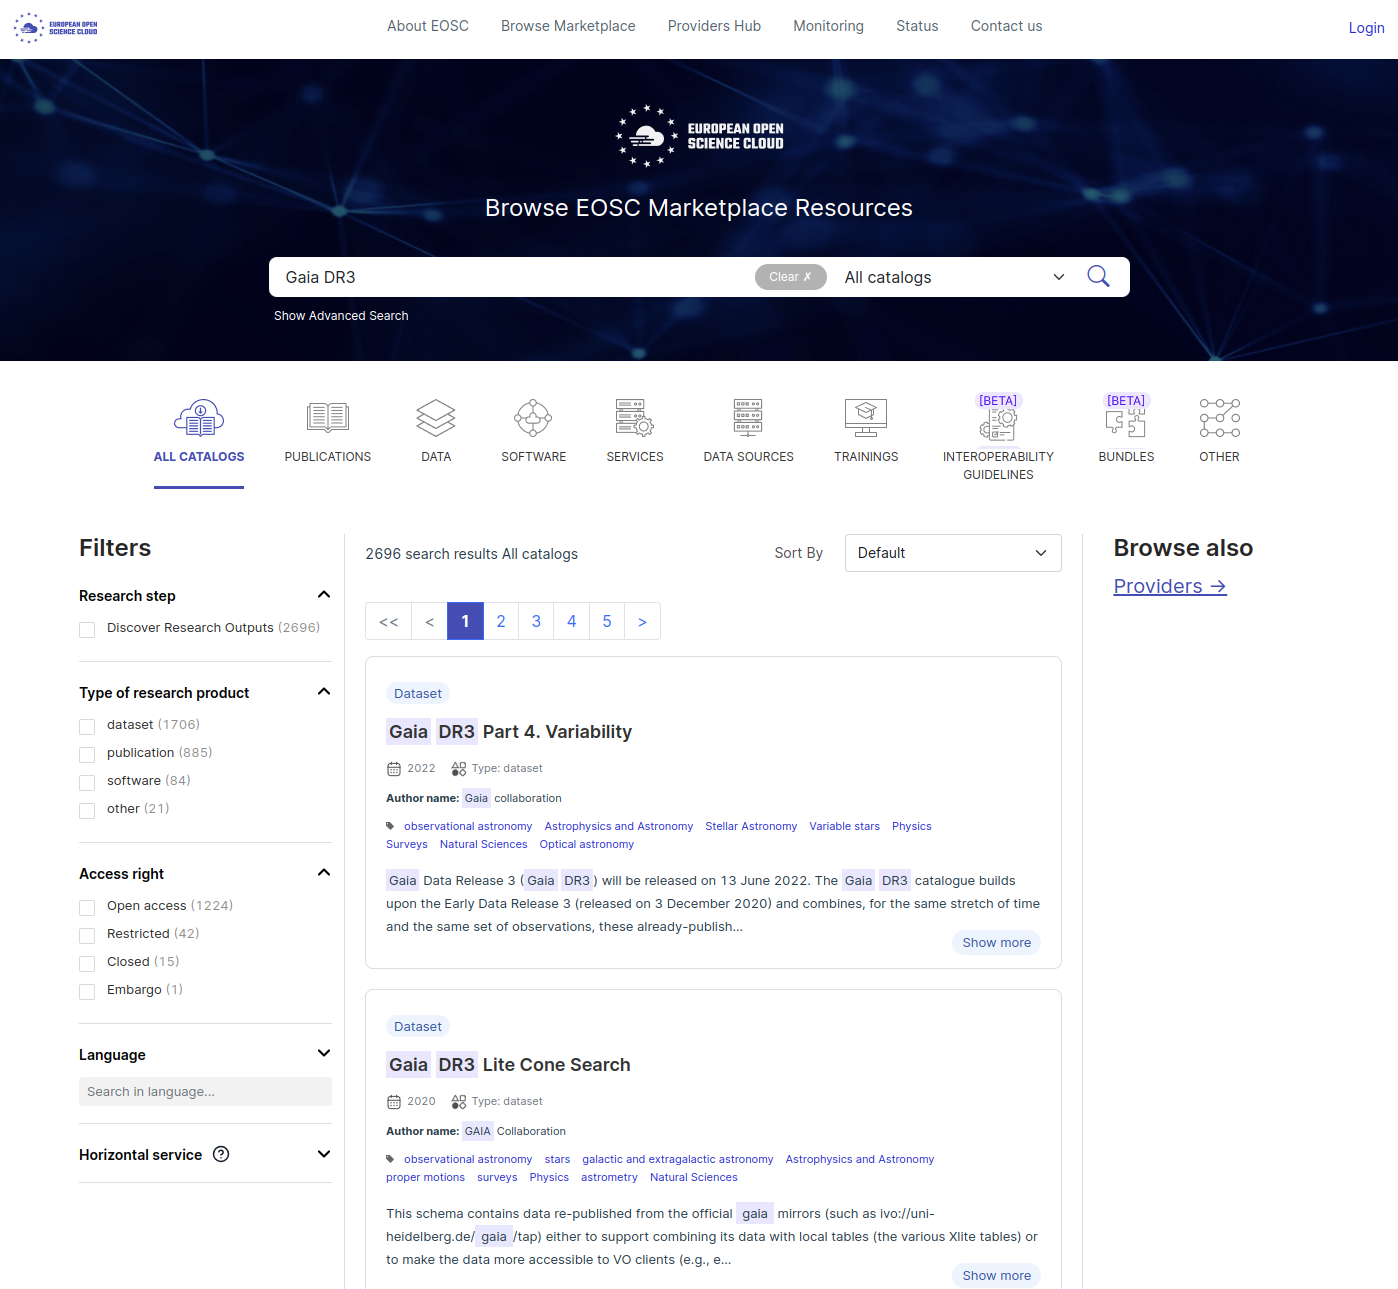
Step 1: Search
The first step is to type the name of your catalogue, dataset, paper, DOI in the Search bar on EOSC portal, as illustrated in the figure below.

You can also browse directly the Marketplace, from the same website. You will get the same results in the end.
Step 2: Scan list of records
A full list of search results appear (link to all results), as illustrated in the figure below. You can filter the results using the ‘Filters’ options on the left, or also by type of data at the top (eg. Catalogs, Publications, Data, Software …).
In our example (Gaia DR3), we can see that the search is done on multiple fields: Title, Author names, abstract.
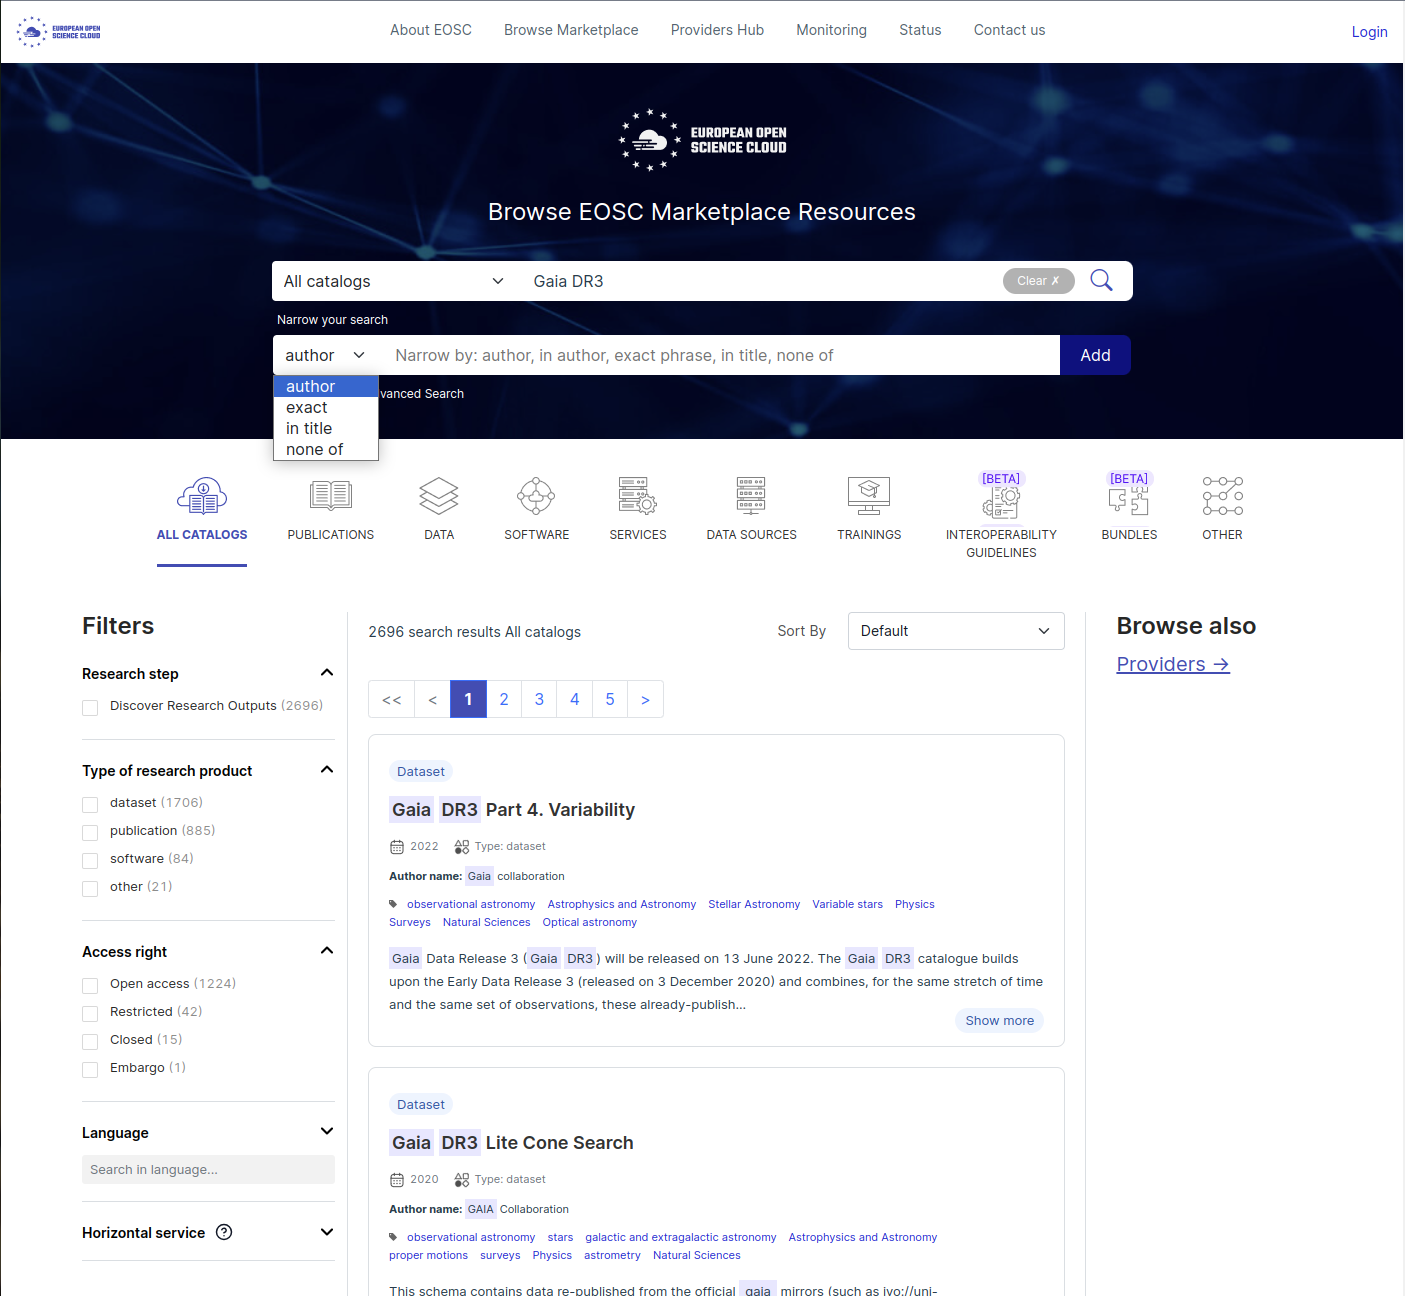
Advanced search
In addition to the filters available on the left side of the EOSC Marketplace results page, more advanced filtering can be done using the ‘Show Advanced Search’ button below the main Search bar.
The search can be narrowed by ‘author’, ‘exact phrase’, ‘in title’, ‘none of’, as illustrated in the Figure below.
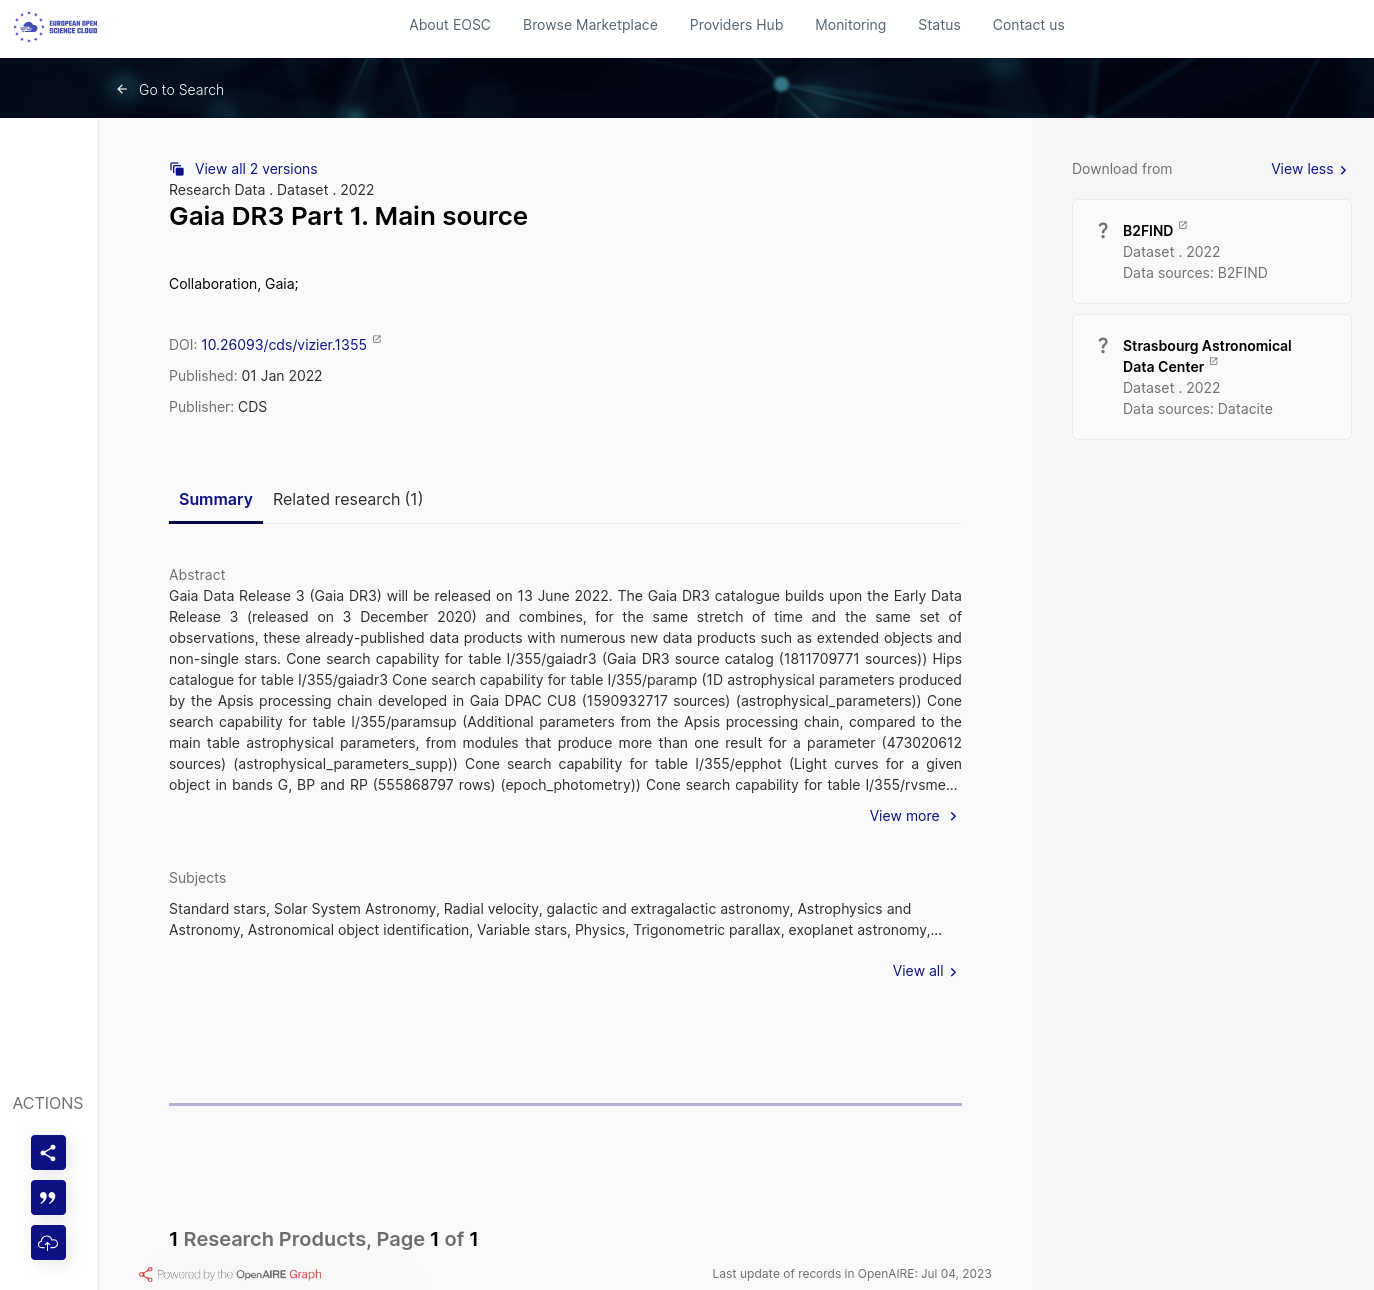
Step 3: Select an entry
Once you found the relevant entry, you can click on it (link to selected result) and see many informations: Title, DOI, Date of publication, Publisher, Abstract, Relevant subjects (keywords), as illustrated in the figure below.
In this example, you can access to the resource by either clicking on the DOI link, or on the ‘Download from’ on the right side of the EOSC page, and then select one of the two data sources available: B2FIND or Strasbourg Astronomical Data Center.
Examples: try it yourself
Can you answer the following questions?
Q1) What is the publication date for ‘Brightest cluster galaxies in Abell clusters’?
Q2) Which CDS service is listed in the ‘Services’ type of results?
Q3) Can you list some ‘cds-astro’ Softwares available?
Q4) Advanced question: can you find the dataset associated with the ‘National Radio Astronomy Observatory’?
Q5) If you published a paper or a dataset, type your name in the Search bar. What do you get as an output?
Browse through EOSC Portal to answer the previous questions.
R1) This paper was published on 01 Jan 2017.
R2) SIMBAD is the service accessible through EOSC portal.
R3) Examples of softwares available: cds-astro/tutorials: v1.0.0, cds-astro/aladin-lite: Aladin Lite v3.1.1, cds-astro/cds-moc-rust: Release v0.5.2, cds-astro/mocpy: Release v0.12.3 …
R4) Leave the Search bar empty, and type ‘National Radio Astronomy Observatory’ as the author in Advanced Search. Launch the search by clicking on the ‘Add’ button.
The search result Data should look like: search-result.
Summary
EOSC is not a new digital infrastructure.
EOSC will support the cultural change towards Open Science and FAIR principles in the European countries and institutions.
Individual researchers will benefits from EOSC through their existing channels (e.g. universities, research institutes, research infrastructures, associations, science clusters, etc.) that will act as intermediaries.
EOSC will allow for universal access to data and a new level playing field for European researchers.
-
EOSC Portal Catalogue & Marketplace acts as an entry point to a multitude of services and resources for researchers, such as:
- Discover Research Outputs (datasets, scientific publications, softwares)
- Access Training Materials (lessons, courses, videos)
The catalogues ingested in VizieR are findable and accessible in EOSC!
Interdisciplinary science is facilitated using EOSC Portal, thanks to the interoperability of the data.
EOSC promotes the reuse of the data.
End!
This concludes this training on how to make your published astronomical data (table, images, spectra, …) FAIR and openly accessible to the community, and discoverable in Virtual Observatory tools such as EOSC.