FAIR principles for astronomical data
Last updated on 2023-11-06 | Edit this page
Overview
Questions
- What are the FAIR principles?
- What does it mean for astronomical data?
- Do and don’t when publishing data
Objectives
- Cite the Findable, Accessible, Interoperable and Reusable (FAIR) principles
- Create FAIR tables
Overview
The CDS and other astronomical data centers are storing and distributing the astronomical data to promote their usage primarily by professional astronomers.
In order to ensure the scientific quality of the data, we therefore require that the data are related to a publication in a refereed journal, either as tables or catalogues actually published, or as a paper describing the data and their context.
Furthermore, the data should be described accurately enough to allow an unambiguous interpretation (of the data), and facilitate their usability.
In this chapter, we will review the best practices for data publication in the astronomical field.

What are the FAIR principles?
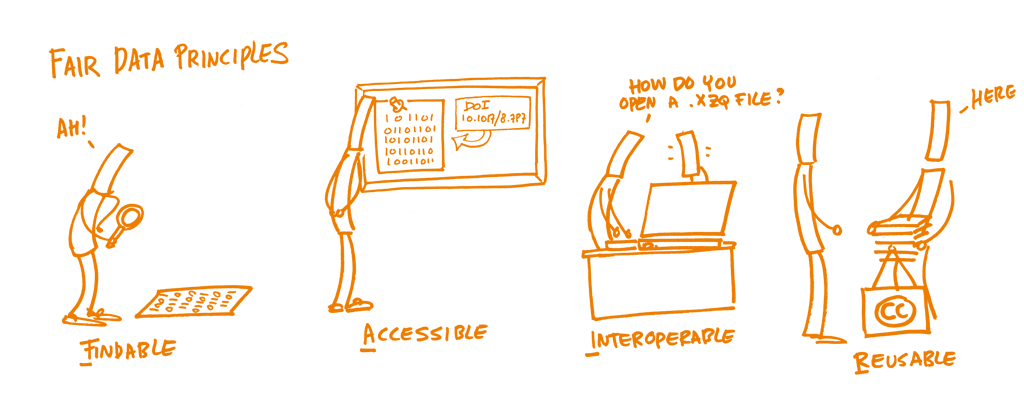
Formalized by Wilkinson et al. in 2016 (DOI: 10.1038/sdata.2016.18), the FAIR Guiding Principles have emerged over the last few years. The underlying idea is to provide a set of guidelines (neither a standard not a specification) for making research data in a broad sense (not only data, but also algorithms, tools, and workflows that led to that data) Findable, Accessible, Interoperable and Reusable, ultimately ensuring standardised machine actionability.
Many great courses can be found online explaining those principles in more details. In this course, we will summarize them and focus more on what it means for astronomical data.
 Credit: Open Science Training Handbook, CC0 1.0 Universal, https://doi.org/10.5281/zenodo.1212496
The FAIR Guiding Principles in more depth
The FAIR Guiding Principles for scientific data management and stewardship as outlined by M. Wilkinson et al. (2016).
The first step before reusing the data is to be able to find them. The metadata and data should be easy to find for both humans and computers.
F1. (Meta)data are assigned a globally unique and persistent identifier
F2. Data are described with rich metadata (defined by R1 below)
F3. Metadata clearly and explicitly include the identifier of the data it describes
F4. (Meta)data are registered or indexed in a searchable resource
Once the data can be found, the user needs to know how to access them. That could include authentification and authorisation. The accessibility of the data does not imply that they are fully open to everyone.
The data should be ‘as open as possible, as closed as necessary’, following the H2020 Program Guidelines on FAIR Data.
A1. (Meta)data are retrievable by their identifier using a standardized communications protocol
- A1.1 The protocol is open, free, and universally implementable
- A1.2 The protocol allows for an authentication and authorization procedure, where necessary
A2. Metadata are accessible, even when the data are no longer available
Those data can then be combined with different datasets, and interoperate with other applications or workflows for analysis, storage, and processing, thanks to rich metadata.
I1. (Meta)data use a formal, accessible, shared, and broadly applicable language for knowledge representation.
I2. (Meta)data use vocabularies that follow FAIR principles
I3. (Meta)data include qualified references to other (meta)data
The ultimate goal of FAIR is to optimise the reuse of data. To achieve this, metadata and data should be well-described, including a clear and accessible license. It should be clear how the data can and cannot be reused, remixed or redistributed.
R1. Meta(data) are richly described with a plurality of accurate and relevant attributes
- R1.1. (Meta)data are released with a clear and accessible data usage license
- R1.2. (Meta)data are associated with detailed provenance
- R1.3. (Meta)data meet domain-relevant community standards
Best Practices for Data Publication in the Astronomical Literature
In 2022, Chen et al. (DOI: 10.3847/1538-4365/ac6268) published a set of guidelines summarizing the best practices for publishing data in astronomy and astrophysics journals. This article is the result of a joint effort from several data centres (NED, CfA, Caltech, CDS, AAS, ADS, among others), as these recommendations are applicable to all those who do data processing.
These recommendations are intended for authors, referees, and science editors to consult in order to avoid various pit-falls that often impede the interpretation of data and metadata by readers, and parsing by software, and therefore also complicate and delay integration of the data into astronomical databases.
Everyone is encouraged to read their paper. For the sake of this course, only their Checklist of Recommendations for Publishing Data in the Literature (Appendix A of their paper) is included below.
Items covered in the Checklist (and also below):
- General rules
- Nomenclature
- Astrometry
- Photometry
- Time
- Redshift/velocity
- Classifications
- Orbital parameters
- Tables
- Figures
- Data archiving and access
- Literature citations
- Facility credits
- Software credits
- Digital object identifiers - DOI
- Data content keywords
Keep calm and carry on
A lot of items will be covered in this section. We are aware that you could be a bit overwhelmed.
The most important points are highlighted in bold, and some tips when creating tables are given at the end.
Do your best and do not hesitate to contact us if needed: cds-cats(at)unistra.fr.
General rules(Section §2 from article)
- Define all symbols, acronyms, and abbreviations at first use.
- Provide uncertainty and confidence level when reporting a new measurement.
- Present the appropriate number of significant figures for numerical measurements and uncertainties that match the precision of the measurements.
- Report the units for measurements if present, and adopt commonly-used ones.
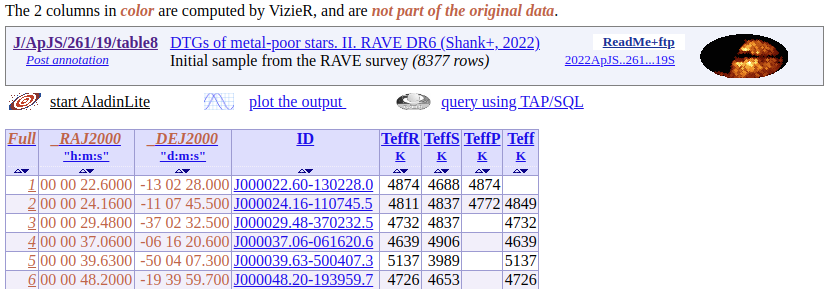
- Indicate preferred values if applicable.
Examples
a) “... used by the Dark Energy Survey (DES)...”
b) The period of a periodic phenomenon should be given as
“P = 1.23456±0.00012 days” instead of “P = 1.23456(12) days”.
c) Present a measurement as 0.123±0.002,
not 0.12345±0.002 or 0.123±0.00234.
d) Present source color “(B-V) = 0.45 mag” instead of “(B-V) = 0.45”
e) State your preferred solution in the text and have a dedicated column
for the adopted solution in your Table, as shown in Table 8 from VizieR catalogue J/ApJS/261/19
Nomenclature (§2.1)
- Provide the complete name for each object. (§2.1.1)
- Include the “J” in names based on J2000 coordinates. (§2.1.1)
- Insert spacers between a catalogue name and the identifiers within the catalogue. (§2.1.1)
- Distinguish between part of an object and the object itself. (§2.1.1)
- Do not use the same name for different objects. (§2.1.1)
- Always assign a name and verify the name is unique. (§2.1.2)
- Keep the appropriate number of significant figures in coordinate-based names. (§2.1.2)
- Use established names for known objects and check for the correct formatting. (§2.1.3)
- Confirm the names and positions for cross-identifications. (§2.1.4)
- Cross-match the same objects in different tables within the same article. (§2.1.4)
Examples
## IAU conventions
a) Use “2MASS J15334944+3759282”, and not “2M 1533+3759”.
b) Use “BR J0529-3526” instead of “BR0529-3526” (which is B1950 by default).
c) Use “B3 2327+391”, and not “B32327+391”.
d) Use “3C 295 cluster” instead of “3C 295” when referring to the cluster.
e) The tau Ceti system now has four planets: e, f, g, and h.
Since tau Ceti b, c, and d were refuted, the letter designations b, c,
and d were not reused for the newer planets to avoid confusion.

## New objects
f) Confirm any new acronym to the Dictionary of Nomenclature of
Celestial Objects.
g) J092712.64+294344.0 indicates a positional accuracy of 0.15 arcsec
while J092712.644+294344.02 indicates an accuracy of 0.015 arcsec.

## Known objects
h) Creating a fanciful name for an object with an existing designation
is especially discourage.
h) Validate all the identifiers for known objects in their publications
through Sesame.
A service hosted by CDS that queries NED, SIMBAD, and VizieR to help
resolve object names.

## Cross-identifications
i) Always verify with established databases that all of the names
given to an object are valid cross-identifications for the object and
that the listed positions are for the same object.
Quiz
Quiz: Why are these astronomical designations improper?
Q1) J2217+2104
Q2) SN 95B
Q3) HESS J232+202
Q4) BR 0529-3526
Q5) B0008+006
Q6) DEM45
Q7) Gaia 2448177130188111232
Q8) Gaia DR 2 2.7904e18
Q9) mu cep
Look for these objects in Simbad.
Can you find them?
I1) Insufficient precision in RA and DEC causes confusion. In this case, it could correspond to many objects and different surveys.
I2) Incomplete name can be interpreted into different objects.
I3) Leading zero in RA is missing and can cause misinterpretation of the RA at 23 hours instead of 02 hour.
I4) Missing letter J to specify J2000 equatorial coordinates.
I5) Name prefix is needed to distinguish between different objects.
I6) H II regions in LMC or SMC should be indicated with “L” or “S” to avoid ambiguity.
I7) Database objectID number is used without specifying release number. The same running number may refer to a different source in a different release.
I8) ID is written in scientific notation, making it impossible to retrieve the actual object (which is a 19-integer number).
I9) Ambiguous name can be interpreted into different objects.
R1) LAMOST J221750.59+210437.1 and SDSS J221746.82+210424.1 are potential matches for this incomplete name
R2) SN 1895B and SN 1995B are different targets
R3) HESS J0232+202
R4) BR J0529-3526
R5) QSO B0008+006 (Redshift z = 2.3) and IVS B0008+006 (Redshift z = 1.5) are different targets
R6) DEM L 045, or DEM S 045
R7) Gaia DR3 2448177130188111232
R8) Gaia DR2 2790494815860044544
R9) µ Cep (Simbad Identifier: * mu. Cep, 21h43m30.46s, +58d46m48.2s, J2000) and MU Cep (Simbad Identifier: V* MU Cep, 22h23m38.63s, +57d40m50.8s, J2000) are different targets
Astrometry (§2.2)
- Provide the best available coordinates.
- Specify the celestial reference system and/or frame.
- Indicate the equinox and epoch of observation when necessary.
- State the wavelength range from which astrometry is obtained.
Examples
a) Complete celestial coordinates are preferred, e.g.,
12h34m56.78s, +12d34m56.7s (Equatorial J2000).
b) Current IAU celestial reference system is ICRS:
the International Celestial Reference System.
c) Standard equinox and epoch currently in use are J2000.0,
but it is not always the case. For example, the reference epoch
for the Gaia Data Release 3 is ICRS at epoch = 2016.0,
while it is epoch = 2015.5 for Gaia Data Release 2
and epoch = 2015.0 for Gaia Data Release 1.
Photometry (§2.3)
- State the facility, telescope and instrument used.
- Describe the method used to estimate photometry.
- Use standard passband/filter identifiers.
- Clarify the magnitude system.
- Specify spectral transitions completely.
Examples
a) Facility ground-based or space-based, specific instrument configuration information.
b) Point spread function fitting, aperture photometry, etc.
c) Indicate “Johnson B” or “Cousins B” instead of just “B”;
use “2MASS Ks” instead of just “K”.
d) Magnitude on the AB, Vega, ST, or some other magnitude system.
e) Carbon monoxide (CO) has several detectable transitions as do ^13^CO
and C^17^O. The most commonly observed transition is (J=1-0) and each is
between 110 and 115 GHz. To clearly define a spectral transition,
one should use, e.g., “CO (J=1-0) ν=115 GHz”.
Time (§2.4)
- Provide the time of observation and exposure time.
- Favor full Julian Dates over abbreviated or offset Julian Dates.
- Include phase timing measures along with reported periods when relevant.
- State when observations from multiple missions are executed simultaneously.
Examples
a) Explicitly described in terms of both the frame of reference
(e.g., JD, BJD, HJD), and the time system used (e.g., UTC, TDB, TAI).
For example, use “BJD-TDB” to indicate Barycentric Julian Date
in the Barycentric Dynamical Time standard (preferred).
b) When reporting Julian Dates, the full unmodified date (e.g., 2456789.123)
is preferred over any offset variation (e.g., 6789.123), to avoid confusion.
Note that MJD (Modified Julian Date) is = Julian Date - 2400000.5, by IAU definition.
c) For a transiting exoplanet orbit where the period is known,
include a time of transit.
d) If possible, include a graphical representation of the times that
the missions obtained the data to help visualize where the simultaneity occurs.
Redshift/velocity (§2.5)
- Describe the method of redshift measurements (spectroscopic, photometric, etc.) and give references to the model/method.
- Specify the reference frame of the redshift measurements (barycentric, heliocentric, galactocentric, etc.).
- Provide the frequency/wavelength from which the measurement is obtained.
- State whether a published recessional velocity is based on observed frequency or wavelength shifts (i.e., radio or optical convention).
- Indicate the quality of the measurement when possible.
Examples
a) Describe particular method (spectroscopic, photometric, Friends-of-Friends, etc.)
and base assumptions used in the models (template fitting, machine learning, etc).
b) Include a clear indication of the reference frame, e.g., heliocentric,
barycentric, Galactocentric, or LSR (Local Standard of Rest).
c) A redshift measured from HI 21 cm emission line may have a significantly
different systematic velocity than a redshift measured from stellar absorption lines
in the same galaxy.
d) The radio velocity increment depends upon the rest frequency,
whereas the optical velocity increment depends on the observing frequency.
e) Add a flag indicating low quality as poor seing or
redshift based on a single spectral line.
Classifications (§2.6)
- Utilize established classifications as available.
- Define (new) classifications clearly.
Examples
a) For basic morphological types, use well-established schemes
(e.g., Sandage 2005).
Authors are encouraged to refer to SIMBAD’s Object Classification
or NED’s galaxy classifications and attributes, which have been standardized
to enable unified queries across journal articles and catalogues.
b) Explain any abbreviations and/or give a definition of the classification.
Orbital parameters (§2.7)
- Avoid using “longitude of periapsis” in place of “argument of periapsis”.
- Be explicit about which body’s orbit a longitude or argument of periapsis refers to (e.g., planet or host star).
- Include time of periapsis as appropriate.
Examples
a) Only use “longitude of periapsis” when referring to the sum of
the argument of periapsis and the longitude of the ascending node.
b) The argument of periapsis for a planet or a secondary star’s orbit
differs from that of the host or primary star’s reflex motion by 180 degrees.
c) When reporting timing for a non-transiting eccentric orbit for
which argument of periapsis is measured, report time of periapsis in preference to
(or in addition to) time of inferior conjunction. Both are preferred if possible. Tables(Section §3.1 from article)
- Provide a clear title and unambiguous labels for columns.
- Explain the content of each column, including symbols and flags.
- Keep each column homogeneous.
- Use the same explicitly defined non-numeric representations for missing (null) values throughout.
- Prepare ReadMe files for machine-readable tables.
- Give the complete names of the objects (§2.1) in each table, and keep the same names in all the tables and text throughout the article when possible.
Examples
a) Indicate the units for each column when applicable.
b) Make a clear distinction between z the redshift, z the filter or z the metallicity.
c) A single column should not present measurements with different units,
mix errors with limits or comments, or append flags to values.

d) Use null values that are supported and documented by widely-used
toolkits, e.g., “NaN” (Not a Number) for floating-point data in Astropy.
Use the same representation for missing data and have a separate field
that explains the reasons for a missing value.
Do not use different representations to indicate the different reasons.

Wrong example: Using 0.00 for “not observed”, and -99.99 for “no detection” in the same column.
Stick to only one NULL value per column!

e) Authors should include a human-readable description of the data,
with at least the column descriptions, units, and references (on the
origin of the measurements or instruments for observations when relevant)
in a ReadMe file. More help on the ReadMe is given in the Chapter "Submitting astronomical data".
Quiz
Quiz: How to make this table FAIR?
| Object | Redshift |
|---|---|
| Source 1 | 0.11 |
| Source 2 | 0.22 |
| Source 3 | 0.31 |
| Source 4 | 0.41 |
| Source 5 | 0.52 |
Redshift quality flag: 1 = secure, 2 = uncertain
The quality of the measurement is indicated using a superscript. Providing this information using an extra column will make the table more machine readable, and therefore the data more reusable.
| Object | Redshift | Quality |
|---|---|---|
| Source 1 | 0.1 | 1 |
| Source 2 | 0.2 | 2 |
| Source 3 | 0.3 | 1 |
| Source 4 | 0.4 | 1 |
| Source 5 | 0.5 | 2 |
Redshift quality flag: 1 = secure, 2 = uncertain
Figures (§3.2)
- Provide clear caption, legend and axis labels for each figure.
- Design the graphics to be accessible.
- Make “data behind the plots” publicly available.
Examples
a) Describe in detail what is presented in the figure, what different
colors, symbols, and lines represent. Units of the axis labels should
be included when applicable. In practice, figures should be able to
stand alone without requiring much reading of the main text.
b) Color-blind users would benefit from symbols that vary in shape
in addition to colors. See the AAS journals’ graphics guide for more advice.
c) Make the original data files used to generate the figures publicly
available, as this will greatly enhance the ability to reproduce,
validate, or build upon published results.
Those files will also be harvested by CDS (as shown in the example below).
Interactive window: Example of spectra generated by VizieR based on original data files (“data behind figure”).
Data archiving and access (Section §4 from article)
- Append small data sets as part of the publication.
- Deposit large or complex data at a long-term archive most appropriate for your data. Adhere to the specific format requirements from the archives.
- Provide a complete list of metadata.
- Include a Data Availability Statement if required by the journal.
- Do not publish data sets at URLs lacking long-term support.
- Use unique and informative names for the files instead of duplicating file names and using location in a directory structure as file metadata necessary to uniquely identify a file.
Examples
a) Preserve data as supplementary materials with your final journal
article, or post the data files with your arXiv preprint.
b) If the data are either too large or too complex to be hosted by the
journal, authors are encouraged to place their data in a trusted
repository that issues Digital Object Identifiers (DOIs).
c) Visualize the position and orientation of the apertures on imagery,
key metadata including aperture dimensions, center coordinates,
and position angle are required.
d) Example from MNRAS.
e) We strongly discourage the publication of URLs to personal web servers
hosting data sets for which the author or institution has no means to maintain
for many years after the publication of the associated journal article.
f) if photometry data are available at different bands (e.g., V and R)
for the same object (e.g., NGC 1275), use names such as NGC1275_V.dat
and NGC1275_R.dat to identify the files. Do not set up separate directories
for V and R band, and give the same file name NGC1275.dat under both directories.
Literature citations (Section §5.1 from article)
- Cite the original references.
- Use preferred citations by the authors.
- Provide full provenance of the data. Credit the originator of archival data, including the Principal Investigator.
- Include all references in the bibliography section.
- Distinguish original data in your article and data taken from other work.
Examples
a)  “We adopted a heliocentric redshift of 1.234 (Smith et al. 2012)
via NED”, where “Smith et al. 2012” is listed correctly in your bibliography.
b) The 2MASS web page requests that you cite the canonical paper by
Skrutskie et al. (2006), instead of the Explanatory Supplement.
d) Make sure all appropriate references to papers, software and data
products are included in a paper’s bibliography section, not just in footnotes.
e) Use phrases such as “This work” to clearly identify original
data in your article.
Facility credits (§5.2)
- Indicate the facilities involved, such as telescopes, instruments, and databases.
- Use standard keywords when possible.
- Include facility’s own statement if available.
Examples
a) Always describe the facilities or services used,
and make sure the name is unique.
b) See AAS keyword tags with AASTeX \facility and \facilities.
c) This research has made use of the VizieR catalogue access tool, CDS,
Strasbourg, France (DOI: 10.26093/cds/vizier). The original description
of the VizieR service was published in 2000, A&AS 143, 23.
Quiz
Quiz: Can you guess the names of these facilities?
Q1) ARO
Q2) DDO
Q3) EMIR
Q4) OSIRIS
| Names as published | Possible interpretation |
|---|---|
| ARO | Astronomical Research Observatory |
| Arizona Radio Observatory | |
| Abbey Ridge Observatory | |
| Algonquin Radio Observatory | |
| DDO | David Dunlap Observatory:0.15m |
| David Dunlap Observatory:0.5m | |
| David Dunlap Observatory:0.6m | |
| David Dunlap Observatory:1.88m | |
| EMIR | Eight MIxer Receiver (on the IRAM 30m radio telescope) |
| Espectrógrafo Multiobjeto Infra-Rojo (on the Gran Telescopio Canarias) | |
| OSIRIS | OH-Suppressing Infra-Red Imaging Spectrograph (on the Keck I telescope) |
| Ohio State Infrared Imager/Spectrograph (on the SOAR telescope) | |
| Optical System for Imaging and low-Intermediate-Resolution Integrated Spectroscopy (on the Gran Telescopio Canarias) |
Data content keywords (Section §6 from article)
- Tag articles with relevant data content keywords from the UAT (Unified Astronomy Thesaurus).
Summary: Small tips for FAIR tables
- For tables containing known astronomical objects, an existing
non-altered name must be given along with the
coordinates.
- Important point: Tables of astronomical objects without coordinates cannot be added into the SIMBAD database.
- All columns must be explained with their corresponding unit.
- Your columns should be homogeneous, and you should avoid mixing measurements with different meanings: errors mixed with limits, or values with different units (that should be in different columns). One same unit per column in a table.
- When there is more than one table, the objects in common must be identified with the same name between tables.
Next chapters
In the next chapters, you will learn what are the different submission routes (depending on your journal) and then how to prepare and submit your data to VizieR. Ultimately you will see how to search your data using the EOSC tools.