Query the sources of a VizieR table that are in a sky region
[1]:
import astropy.units as u
from mocpy import MOC
First, we retrieve the MOC for VizieR table VIII/84/7c
[2]:
moc = MOC.from_vizier_table("VIII/84/7c", nside=64)
[3]:
moc.display_preview()

Then, we query Hipparcos catalogue to get all sources in the MOC coverage
[4]:
# table = moc.query_simbad(10000)
table = moc.query_vizier_table("I/239/hip_main", max_rows=100000)
table
   _RAJ2000       _DEJ2000    recno   HIP   ... Notes   _RA.icrs     _DE.icrs
     deg            deg                     ...           deg          deg
-------------- -------------- ------ ------ ... ----- ------------ ------------
  1.5468688953  87.8894244013    513    513 ...         1.54686890  87.88942440
  4.0222774349  88.4011934198   1284   1284 ...         4.02227743  88.40119342
  4.4701298766  44.5779461534   1433   1434 ...         4.47012988  44.57794615
  4.5823503880  44.5584124080   1473   1474 ...         4.58235039  44.55841241
  4.5953557332  44.0229534917   1474   1475 ...         4.59535573  44.02295349
  4.6695923454  44.6299885536   1495   1496 ...         4.66959235  44.62998855
  4.6757036057  43.7911411989   1500   1501 ...         4.67570361  43.79114120
  4.9750713825  44.7094160244   1591   1593 ...         4.97507138  44.70941602
  5.1325470462  43.6942792303   1639   1641 ...         5.13254705  43.69427923
  5.1375081607  45.5089274590   1640   1642 ...         5.13750816  45.50892746
           ...            ...    ...    ... ...   ...          ...          ...
282.1275858638  72.4330734846  92200  92284 ...     D 282.12758586  72.43307348
282.2003081762  68.8765968536  92222  92306 ...       282.20030818  68.87659685
283.2537664404  71.7872258744  92587  92672 ...       283.25376644  71.78722587
283.5993944657  71.2971919103  92697  92782 ...       283.59939447  71.29719191
284.3387071233  71.9985386037  92974  93059 ...       284.33870712  71.99853860
284.4097604809  72.8411366755  92995  93080 ...       284.40976048  72.84113668
309.6976234553  89.4065064126 101792 101884 ...       309.69762346  89.40650641
323.7139039566  89.2229491933 106464 106556 ...       323.71390396  89.22294919
351.7536416060  87.3075039848 115644 115746 ...       351.75364161  87.30750398
355.9505221876  87.3548934198 116949 117053 ...       355.95052219  87.35489342
Length = 16379 rows
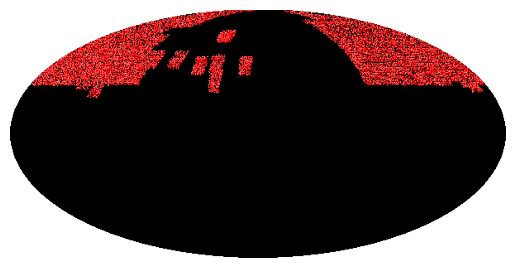
Finally, we plot the positions of the sources in the table to check if they lie in the MOC coverage
[5]:
moc_table = MOC.from_lonlat(
    table["_RAJ2000"].T * u.deg,
    table["_DEJ2000"].T * u.deg,
    max_norder=7,
)
moc_table.display_preview()