Creating Space-MOCs from shapes
[1]:
import matplotlib.pyplot as plt
import numpy as np
from astropy import units as u
from astropy.coordinates import SkyCoord
from mocpy import MOC
Create a MOC from cone(s)
Single cone
[2]:
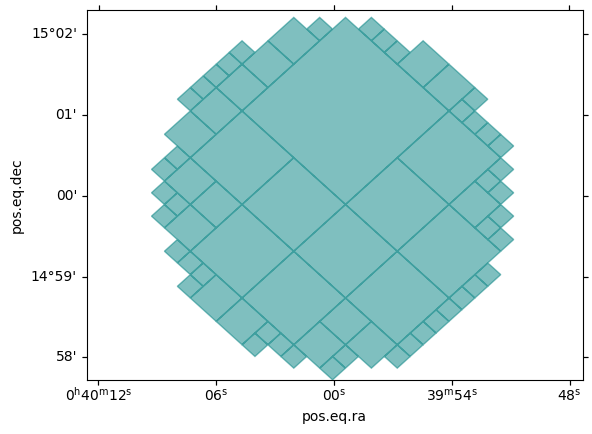
cone = MOC.from_cone(10 * u.deg, 15 * u.deg, radius=2 * u.arcmin, max_depth=14)

fig = plt.figure()
wcs = cone.wcs(fig)  # automatically creates a wcs for the MOC
ax = fig.add_subplot(projection=wcs)
cone.fill(ax, wcs, color="teal", alpha=0.5)
Multiple cones, same radius
[3]:
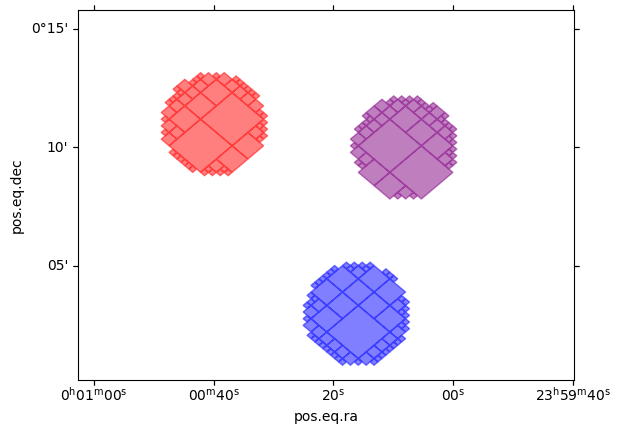
cones = MOC.from_cones(
    [10, 4, 2] * u.arcmin,
    [11, 3, 10] * u.arcmin,
    radius=2 * u.arcmin,
    max_depth=14,
)

fig = plt.figure()
wcs = sum(cones).wcs(fig)  # automatically creates a wcs for the union of the MOC
ax = fig.add_subplot(projection=wcs)
for cone, color in zip(cones, ["red", "blue", "purple"]):
    cone.fill(ax, wcs, color=color, alpha=0.5)
Multiple cones, different radii
[4]:
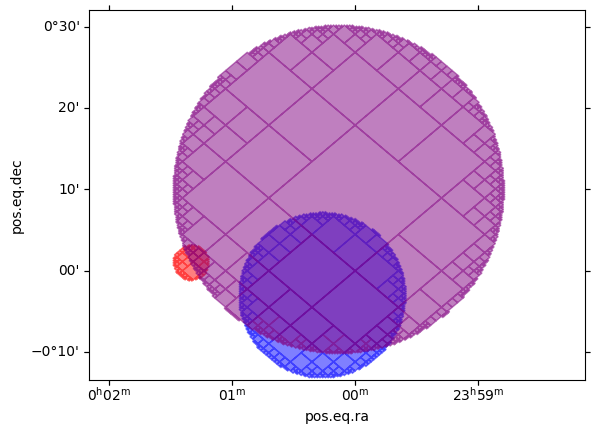
cones = MOC.from_cones(
    [20, 4, 2] * u.arcmin,
    [1, -3, 10] * u.arcmin,
    radius=[2, 10, 20] * u.arcmin,
    max_depth=14,
)
fig = plt.figure()
wcs = sum(cones).wcs(fig)  # automatically creates a wcs for the union of the MOC
ax = fig.add_subplot(projection=wcs)
for cone, color in zip(cones, ["red", "blue", "purple"]):
    cone.fill(ax, wcs, color=color, alpha=0.5)
Getting a unique MOC from a list of cones
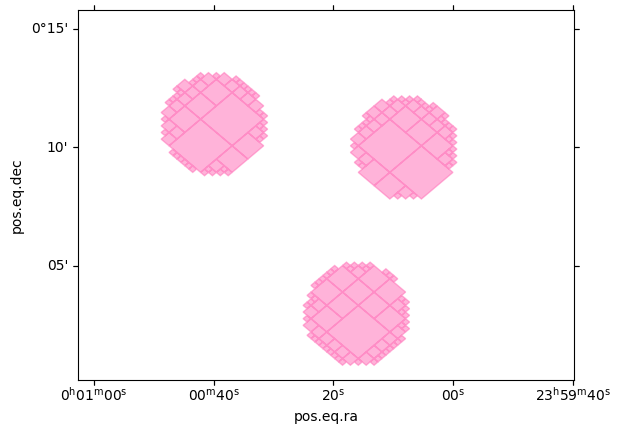
If you don’t need the list of MOCs corresponding to each cone, but you only need the sum of all MOCs, then from_cones with the option union_strategy will be faster.
For cones that don’t overlap, the small_cones will be faster
[5]:
moc = MOC.from_cones(
    [10, 4, 2] * u.arcmin,
    [11, 3, 10] * u.arcmin,
    radius=2 * u.arcmin,
    max_depth=14,
    union_strategy="small_cones",
)

fig = plt.figure()
wcs = moc.wcs(fig)
ax = fig.add_subplot(projection=wcs)
moc.fill(ax, wcs, color="hotpink", alpha=0.5)
[6]:
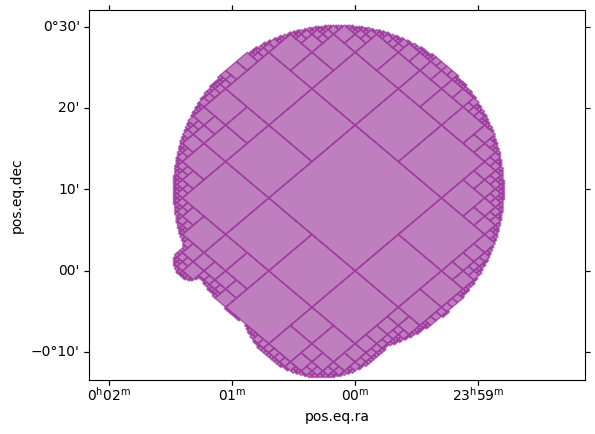
cone = MOC.from_cones(
    [20, 4, 2] * u.arcmin,
    [1, -3, 10] * u.arcmin,
    radius=[2, 10, 20] * u.arcmin,
    max_depth=14,
    union_strategy="large_cones",
)
fig = plt.figure()
wcs = cone.wcs(fig)
ax = fig.add_subplot(projection=wcs)
cone.fill(ax, wcs, color="purple", alpha=0.5)
Create MOCs from box(es)
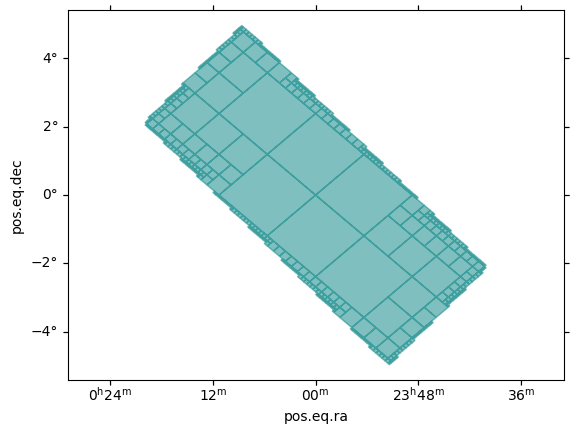
A single box. A box is defined by a center and is the intersection of two spherical wedges (thus the borders and inside cross defined by the angles follow great circles).
[7]:
moc = MOC.from_box(
    lon=0 * u.deg,
    lat=0 * u.deg,
    a=5 * u.deg,
    b=2 * u.deg,
    angle=45 * u.deg,
    max_depth=10,
)

fig = plt.figure()
wcs = moc.wcs(fig)  # automatically creates a wcs for the MOC
ax = fig.add_subplot(projection=wcs)
moc.fill(ax, wcs, color="teal", alpha=0.5)
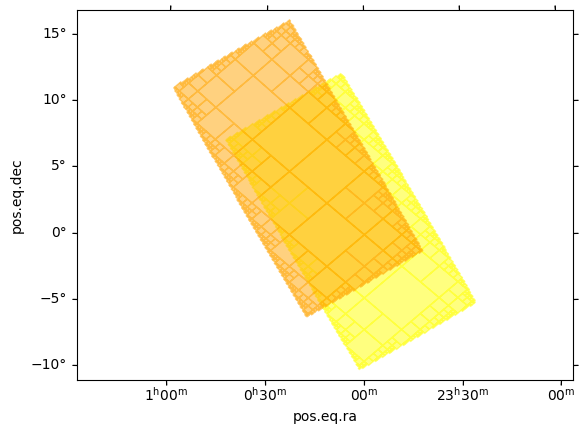
A set of identical boxes (this is more efficient than calling from_box a lot of times. This method is multi-threaded)
[8]:
boxes = MOC.from_boxes(
    lon=[1, 5] * u.deg,
    lat=[1, 5] * u.deg,
    a=10 * u.deg,
    b=5 * u.deg,
    angle=30 * u.deg,
    max_depth=10,
)
fig = plt.figure()
wcs = sum(boxes).wcs(fig)  # automatically creates a wcs for the union of the MOC
ax = fig.add_subplot(projection=wcs)
for box, color in zip(boxes, ["yellow", "orange"]):
    box.fill(ax, wcs, color=color, alpha=0.5)
[9]:
boxes = MOC.from_boxes(
    lon=[1, 7, 2] * u.deg,
    lat=[2, 6, 10] * u.deg,
    a=[10, 20, 5] * u.deg,
    b=[5, 5, 5] * u.deg,
    angle=[30, 10, 5] * u.deg,
    max_depth=10,
)
fig = plt.figure()
wcs = sum(boxes).wcs(fig)  # automatically creates a wcs for the union of the MOC
ax = fig.add_subplot(projection=wcs)
for box, color in zip(boxes, ["blue", "teal", "green"]):
    box.fill(ax, wcs, color=color, alpha=0.5)
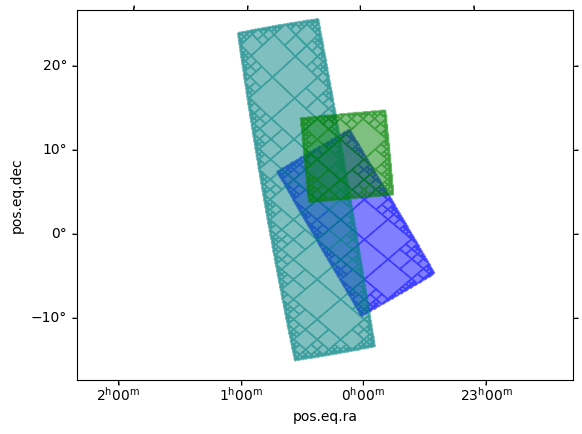
Single MOC from a list of boxes
Just as for cones, you can also get the union of MOCs from boxes by chosing either small_boxes or large_boxes for the union_strategy parameter.
[10]:
moc = MOC.from_boxes(
    lon=[1, 7, 2] * u.deg,
    lat=[2, 6, 10] * u.deg,
    a=[10, 20, 5] * u.deg,
    b=[5, 5, 5] * u.deg,
    angle=[30, 10, 5] * u.deg,
    max_depth=10,
    union_strategy="large_boxes",
)
fig = plt.figure()
wcs = moc.wcs(fig)  # automatically creates a wcs for the union of the MOC
ax = fig.add_subplot(projection=wcs)
moc.fill(ax, wcs, color="green", alpha=0.5)
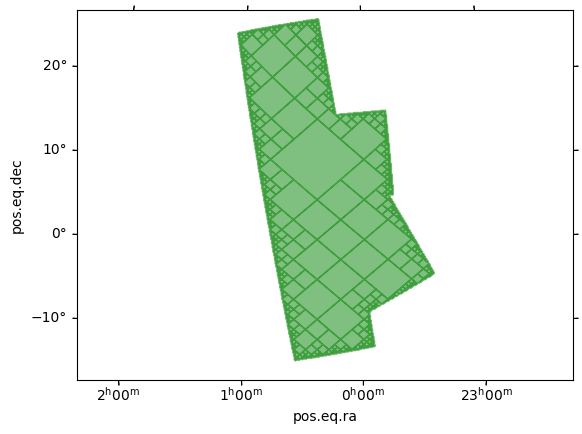
Create a MOC from a zone
A zone is defined by a range of longitudes and latitudes. It follows great circles on the longitudinal axis and small circles on the latitudinal axis.
[11]:
moc = MOC.from_zone(
    SkyCoord([[-50, -50], [50, 50]], unit="deg"),
    max_depth=10,
)

fig = plt.figure()
wcs = moc.wcs(fig)  # automatically creates a wcs for the MOC
ax = fig.add_subplot(projection=wcs)
moc.fill(ax, wcs, color="teal", alpha=0.5)
ax.grid(visible=True)
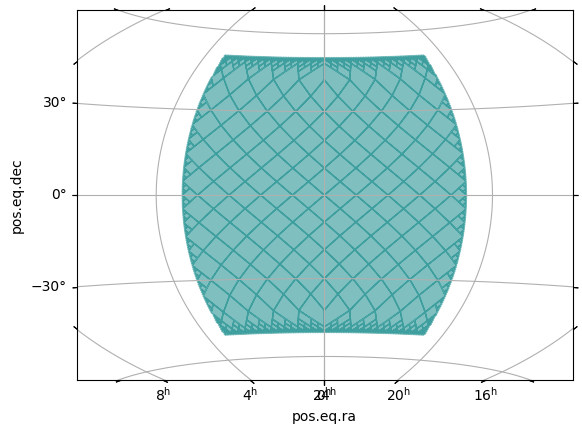
Create MOCs from polygon(s)
[12]:
# Methods for defining random polygons


def generate_rand_polygon(num_points):
    """Generate a random polygon.

    Parameters
    ----------
        num_points : int
            number of random points to generate

    Returns
    -------
        (astropy.units.quantity.Quantity, astropy.units.quantity.Quantity)
            a tuple containing the longitudes and latitudes of the random points
    """
    lon_min, lon_max = (-5, 5)
    lat_min, lat_max = (-5, 5)
    rng = np.random.default_rng(0)
    lon = (rng.random(num_points) * (lon_max - lon_min) + lon_min) * u.deg
    lat = (rng.random(num_points) * (lat_max - lat_min) + lat_min) * u.deg
    return lon, lat


def generate_concave_polygon(num_points, lon_offset, lat_offset):
    """Generate a concave polygon.

    Parameters
    ----------
    num_points : int
        the number of corners
    lon_offset : float
        offset in longitudinal direction
    lat_offset : float
        offset in latitudinal direction

    Returns
    -------
    (astropy.units.quantity.Quantity, astropy.units.quantity.Quantity)
        a tuple containing the longitudes and latitudes of the random points
    """
    radius_max = 10
    rng = np.random.default_rng(1)
    angles = np.linspace(0, 2 * np.pi, num_points)
    radius = rng.random(angles.shape[0]) * radius_max

    lon = (np.cos(angles) * radius + lon_offset) * u.deg
    lat = (np.sin(angles) * radius + lat_offset) * u.deg
    return lon, lat


def generate_convexe_polygon(num_points, lon_offset, lat_offset):
    """Generate the corners on a convexe polygon.

    Parameters
    ----------
    num_points : int
        the number of corners
    lon_offset : float
        offset in longitudinal direction
    lat_offset : float
        offset in latitudinal direction

    Returns
    -------
    (astropy.units.quantity.Quantity, astropy.units.quantity.Quantity)
        a tuple containing the longitudes and latitudes of the random points
    """
    radius_max = 10
    rng = np.random.default_rng(2)
    angles = np.linspace(0, 2 * np.pi, num_points)
    radius = rng.random() * radius_max * np.ones(angles.shape[0])

    lon = (np.cos(angles) * radius + lon_offset) * u.deg
    lat = (np.sin(angles) * radius + lat_offset) * u.deg
    return lon, lat
[13]:
%%time
# Let's generate four MOCs


## Two random ones
lon, lat = generate_rand_polygon(12)
random_moc_1 = MOC.from_polygon(lon=lon, lat=lat, max_depth=12)

lon, lat = generate_rand_polygon(5)
random_moc_2 = MOC.from_polygon(lon=lon, lat=lat, max_depth=12)

## A convexe one
lon, lat = generate_convexe_polygon(15, 20, 7)
convexe_moc = MOC.from_polygon(lon=lon, lat=lat, max_depth=12)

## A concave one
lon, lat = generate_concave_polygon(15, 20, 7)
concave_moc = MOC.from_polygon(lon=lon, lat=lat, max_depth=12)
CPU times: user 47.2 ms, sys: 2.2 ms, total: 49.4 ms
Wall time: 52 ms
[14]:
# Let's plot the results

fig = plt.figure()

wcs = convexe_moc.wcs(fig)  # automatically creates a wcs for the MOC
ax1 = fig.add_subplot(221, projection=wcs)  # The first of a 2*2 grig of subplots
convexe_moc.fill(
    ax1,
    wcs,
    color="hotpink",
    alpha=0.5,
)  # Where the MOC is added to the plot
ax1.set_title("A convexe MOC")  # Comments and titles

wcs = random_moc_1.wcs(fig)
ax2 = fig.add_subplot(222, projection=wcs)
random_moc_1.fill(ax2, wcs, color="lightblue", alpha=0.5)
ax2.set_title("A first random MOC")

wcs = random_moc_2.wcs(fig)
ax3 = fig.add_subplot(223, projection=wcs)
random_moc_2.fill(ax3, wcs, color="lightgreen", alpha=0.5)
ax3.set_title("A second random MOC")

wcs = concave_moc.wcs(fig)
ax4 = fig.add_subplot(224, projection=wcs)
concave_moc.fill(ax4, wcs, color="yellow", alpha=0.5)
ax4.set_title("And a concave one")

fig.tight_layout()  # prevents overlapping labels
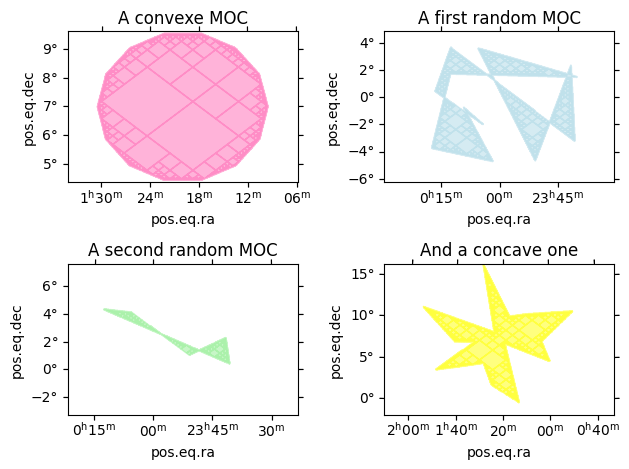
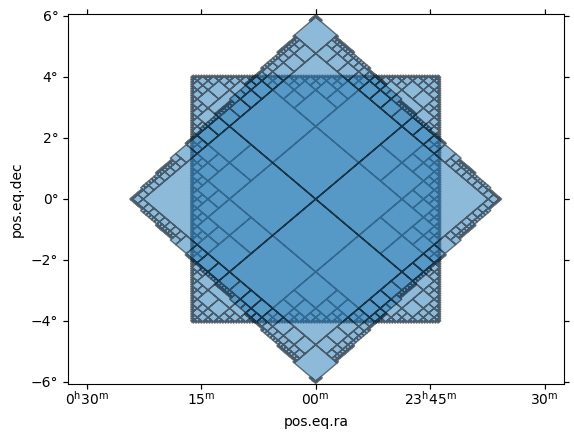
To generate a lot of MOCs from a list of polygons, use the from_polygons method.
[15]:
list_vertices = [
    SkyCoord([-4, 4, 4, -4], [4, 4, -4, -4], unit="deg"),
    SkyCoord([0, 6, 0, -6], [6, 0, -6, 0], unit="deg"),
]
list_mocs = MOC.from_polygons(list_vertices)
[16]:
# Let's plot them
fig = plt.figure()
wcs = sum(list_mocs).wcs(fig)  # gets the WCS for the union of the mocs
ax = fig.add_subplot(projection=wcs)
for moc in list_mocs:
    moc.fill(ax, wcs, alpha=0.5)
