Examples
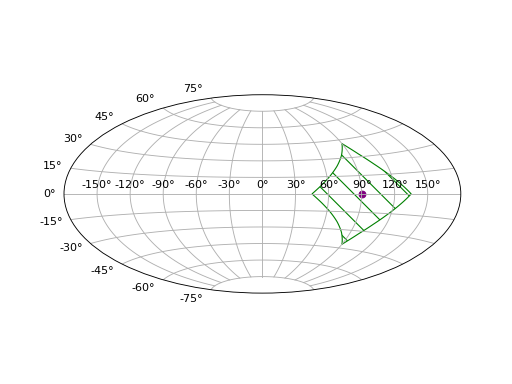
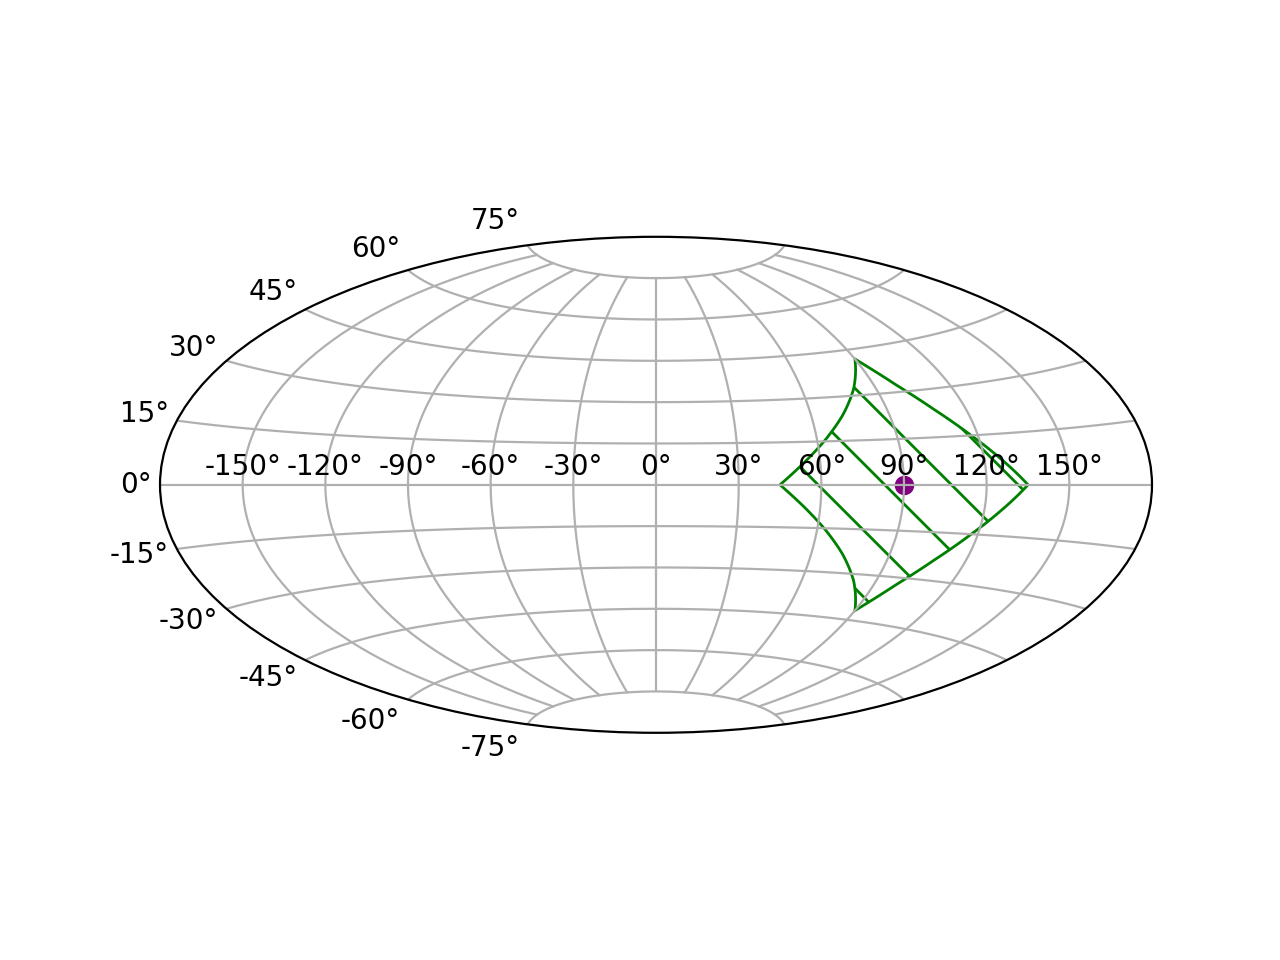
Getting coordinates in a HEALPix cell
In this example, we chose a HEALPix cell, and we plot its center
"""Plot a cell and its center."""

from cdshealpix.nested import healpix_to_lonlat, vertices

import astropy.units as u
import matplotlib.pyplot as plt
from matplotlib.patches import Polygon
import numpy as np

# choose a cell
ipix = 5
depth = 0

fig = plt.figure()
ax = fig.add_subplot(projection="aitoff")
ax.grid(visible=True)
# plot the center of the cell
lon, lat = healpix_to_lonlat(ipix, depth)
ax.scatter(lon, lat, color="purple")
# plot the cell
border_lon, border_lat = vertices(ipix, depth, step=5)
border_lon = border_lon.wrap_at(180 * u.deg).radian[0]
border_lat = border_lat.radian[0]
polygon = Polygon(
    np.column_stack((border_lon, border_lat)), fill=False, edgecolor="green", hatch="\\"
)
ax.add_patch(polygon)
plt.show()
(Source code, png, hires.png, pdf)
Getting the healpix cells contained in a region of the sky
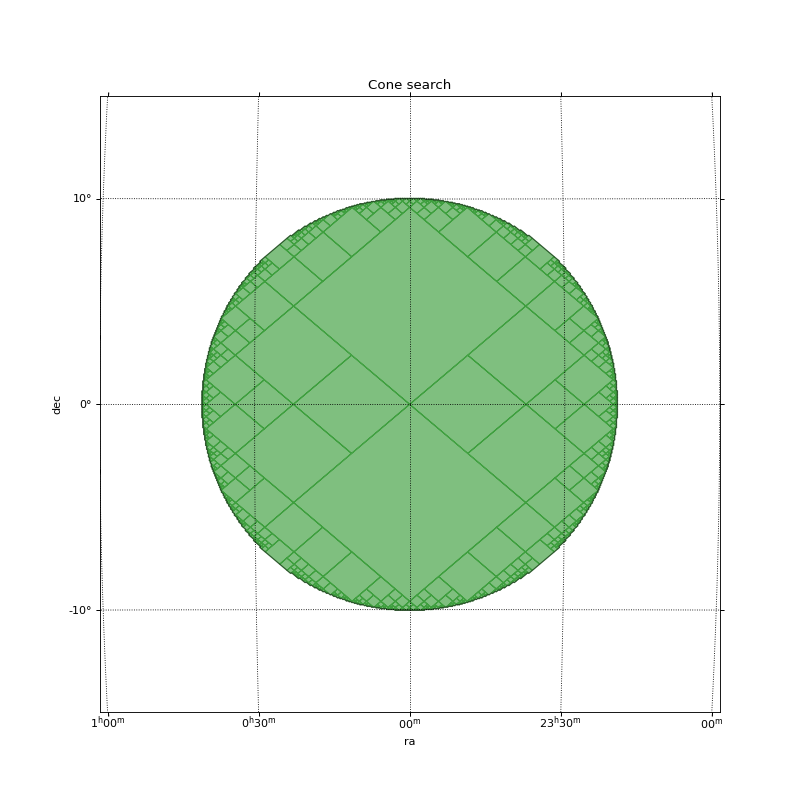
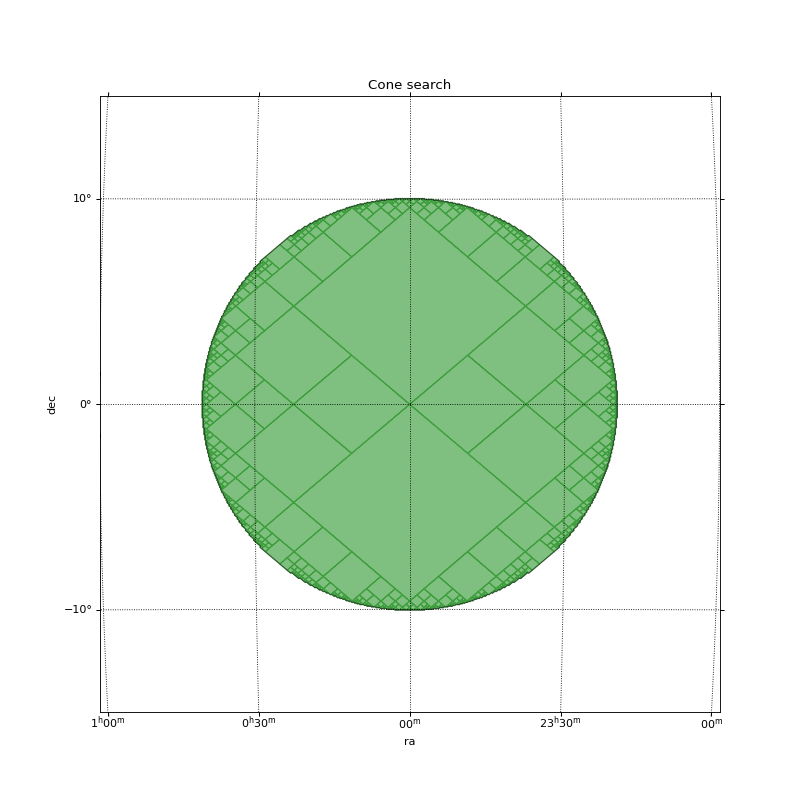
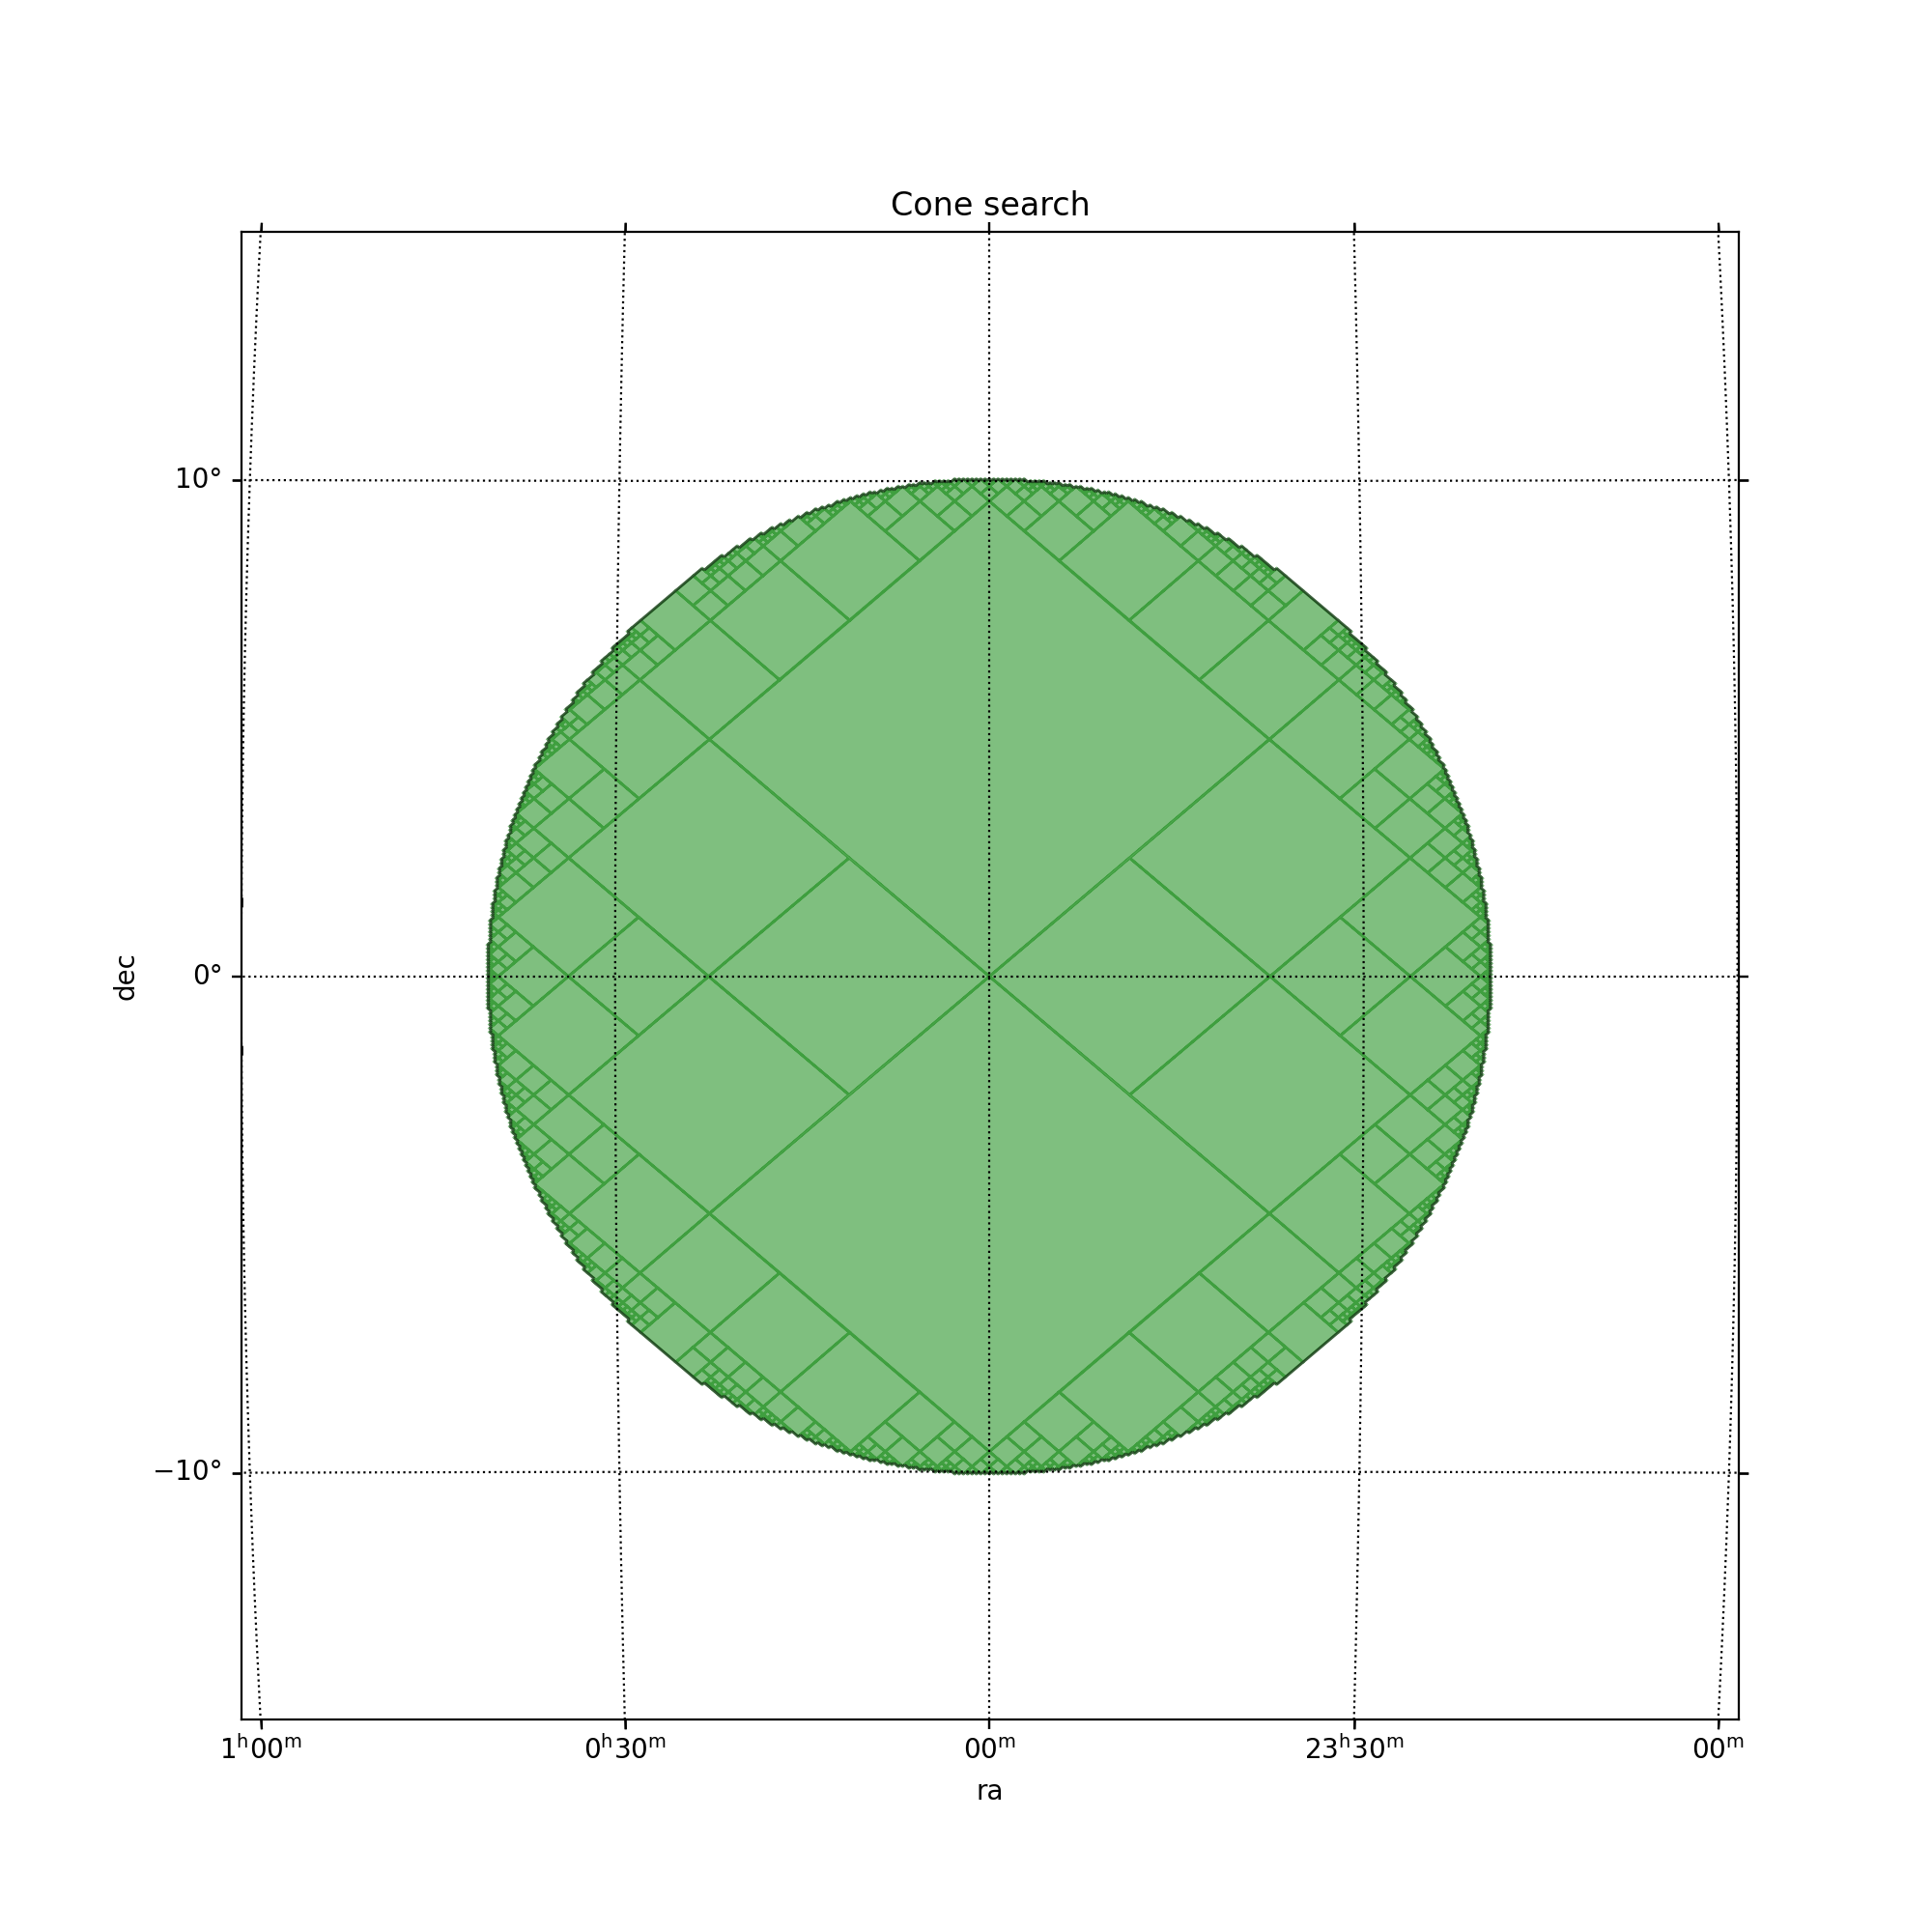
Cone search
"""Demonstration of the cone_search function."""

# Astropy tools
import astropy.units as u

# For plots
import matplotlib.pyplot as plt
from astropy.coordinates import Angle, Latitude, Longitude, SkyCoord

# Moc and HEALPix tools
from cdshealpix.nested import cone_search
from mocpy import MOC, WCS

max_depth = 10

ipix, depth, fully_covered = cone_search(
    lon=Longitude(0, u.deg), lat=Latitude(0, u.deg), radius=10 * u.deg, depth=max_depth
)


moc = MOC.from_healpix_cells(ipix, depth, max_depth)
# Plot the MOC using matpl/Wordotlib


fig = plt.figure(111, figsize=(10, 10))
# Define a astropy WCS from the mocpy.WCS class
with WCS(
    fig,
    fov=30 * u.deg,
    center=SkyCoord(0, 0, unit="deg", frame="icrs"),
    coordsys="icrs",
    rotation=Angle(0, u.degree),
    projection="AIT",
) as wcs:
    ax = fig.add_subplot(1, 1, 1, projection=wcs)
    # Call fill with a matplotlib axe and the `~astropy.wcs.WCS` wcs object.
    moc.fill(ax=ax, wcs=wcs, alpha=0.5, fill=True, color="green")
    # Draw the perimeter of the MOC in black
    moc.border(ax=ax, wcs=wcs, alpha=0.5, color="black")
plt.xlabel("ra")
plt.ylabel("dec")
plt.title("Cone search")
plt.grid(color="black", linestyle="dotted")
plt.show()
(Source code, png, hires.png, pdf)
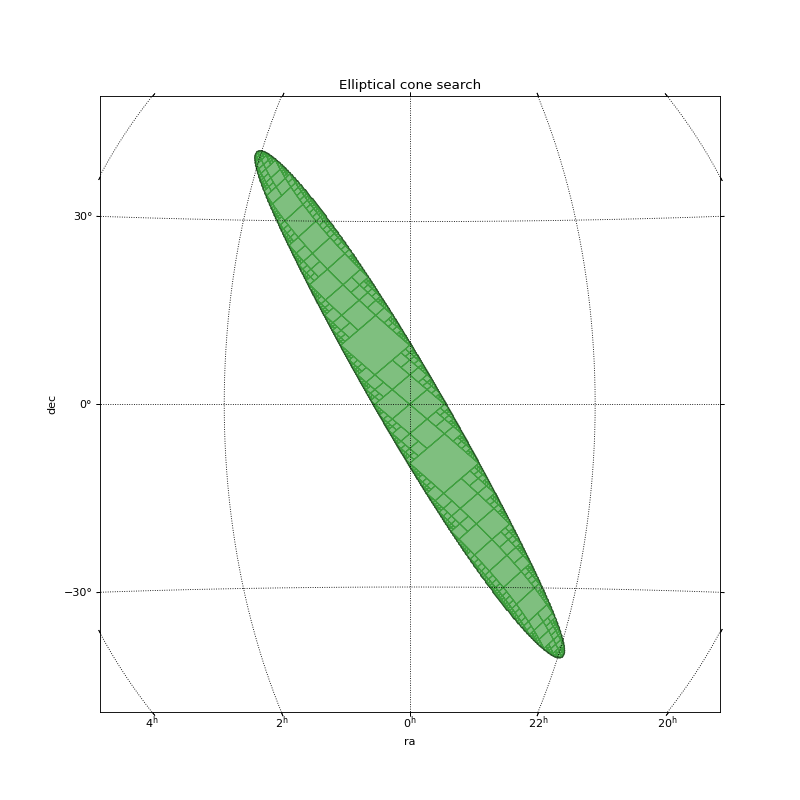
Elliptical cone search
"""Illustration of the elliptical cone search functionnality."""

# Astropy tools
import astropy.units as u

# For plots
import matplotlib.pyplot as plt
from astropy.coordinates import Angle, Latitude, Longitude, SkyCoord

# Moc and HEALPix tools
from cdshealpix import elliptical_cone_search
from mocpy import MOC, WCS

max_depth = 10

ipix, depth, fully_covered = elliptical_cone_search(
    lon=Longitude(0, u.deg),
    lat=Latitude(0, u.deg),
    a=Angle(50, unit="deg"),
    b=Angle(5, unit="deg"),
    pa=Angle(30, unit="deg"),
    depth=max_depth,
)

moc = MOC.from_healpix_cells(ipix, depth, max_depth)
# Plot the MOC using matplotlib


fig = plt.figure(111, figsize=(10, 10))
# Define a astropy WCS easily
with WCS(
    fig,
    fov=100 * u.deg,
    center=SkyCoord(0, 0, unit="deg", frame="icrs"),
    coordsys="icrs",
    rotation=Angle(0, u.degree),
    projection="AIT",
) as wcs:
    ax = fig.add_subplot(1, 1, 1, projection=wcs)
    # Call fill with a matplotlib axe and the `~astropy.wcs.WCS` wcs object.
    moc.fill(ax=ax, wcs=wcs, alpha=0.5, fill=True, color="green")
    # Draw the perimeter of the MOC in black
    moc.border(ax=ax, wcs=wcs, alpha=0.5, color="black")
plt.xlabel("ra")
plt.ylabel("dec")
plt.title("Elliptical cone search")
plt.grid(color="black", linestyle="dotted")
plt.show()
(Source code, png, hires.png, pdf)

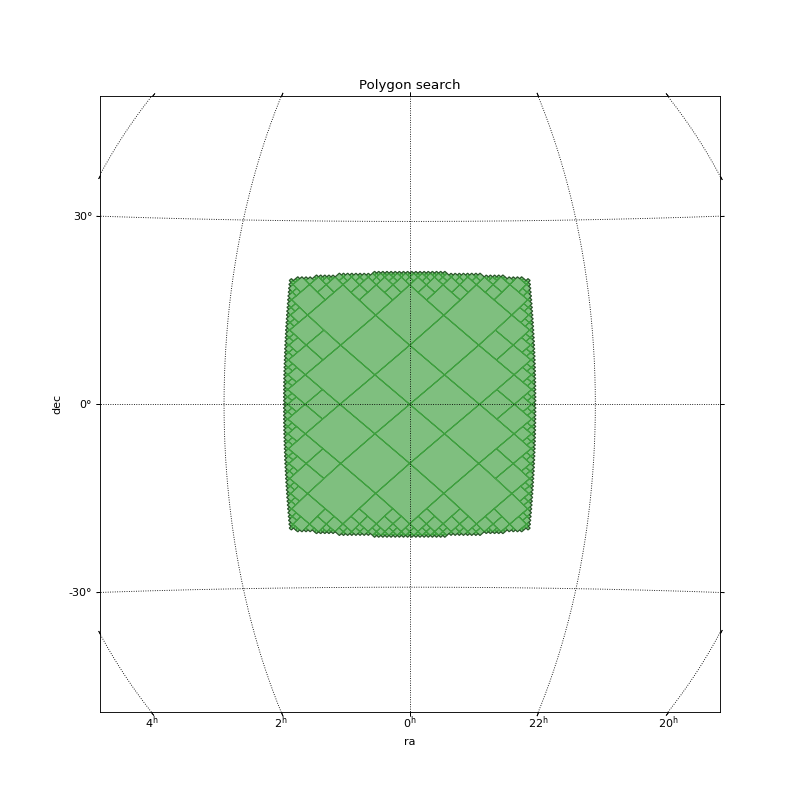
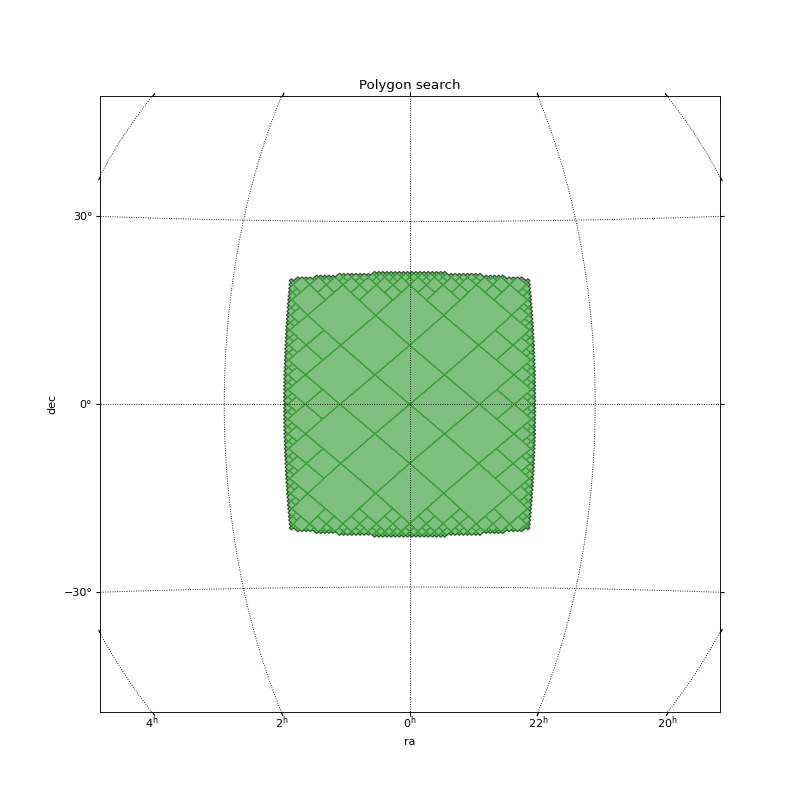
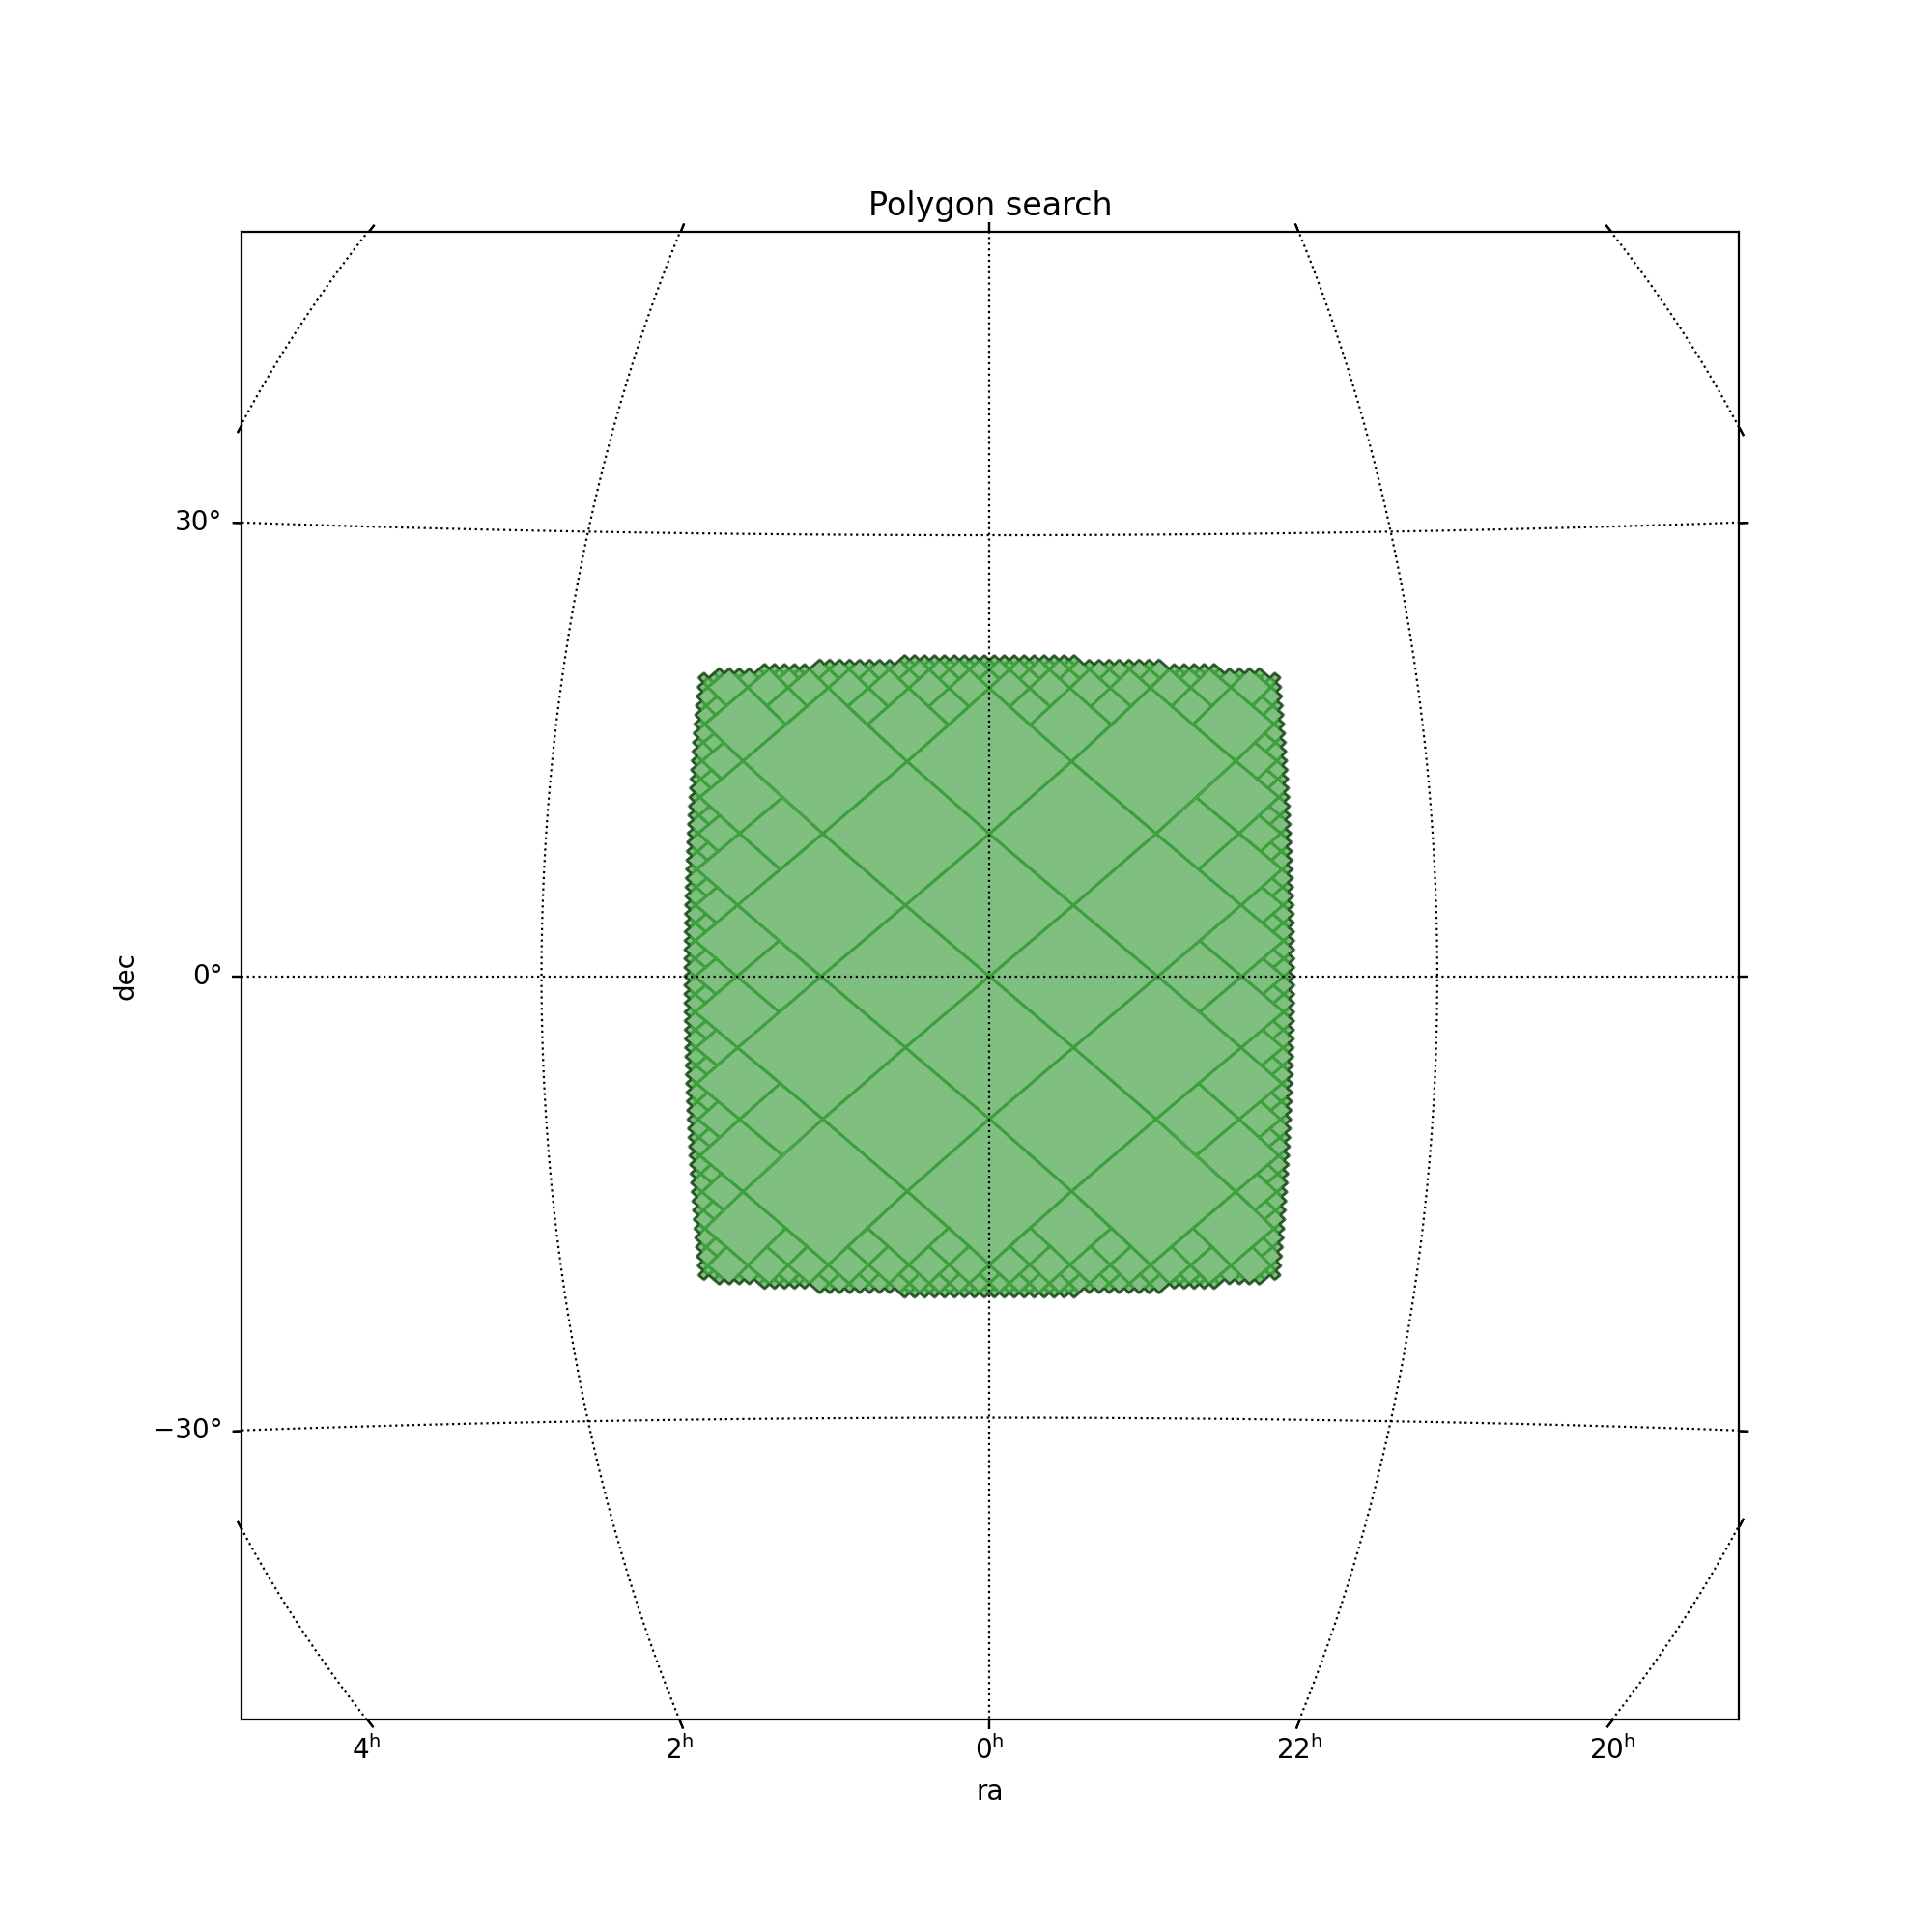
Polygon search
"""Example for polygon HEALPix."""

# Astropy tools
import astropy.units as u

# For plots
import matplotlib.pyplot as plt
from astropy.coordinates import Angle, Latitude, Longitude, SkyCoord

# Moc and HEALPix tools
from cdshealpix import polygon_search
from mocpy import MOC, WCS

lon = Longitude([20, -20, -20, 20], u.deg)
lat = Latitude([20, 20, -20, -20], u.deg)

max_depth = 7
ipix, depth, fully_covered = polygon_search(lon, lat, max_depth)


moc = MOC.from_healpix_cells(ipix, depth, max_depth)
# Plot the MOC using matplotlib


fig = plt.figure(111, figsize=(10, 10))
# Define a astropy WCS easily
with WCS(
    fig,
    fov=100 * u.deg,
    center=SkyCoord(0, 0, unit="deg", frame="icrs"),
    coordsys="icrs",
    rotation=Angle(0, u.degree),
    projection="AIT",
) as wcs:
    ax = fig.add_subplot(1, 1, 1, projection=wcs)
    # Call fill with a matplotlib axe and the `~astropy.wcs.WCS` wcs object.
    moc.fill(ax=ax, wcs=wcs, alpha=0.5, fill=True, color="green")
    # Draw the perimeter of the MOC in black
    moc.border(ax=ax, wcs=wcs, alpha=0.5, color="black")
plt.xlabel("ra")
plt.ylabel("dec")
plt.title("Polygon search")
plt.grid(color="black", linestyle="dotted")
plt.show()
(Source code, png, hires.png, pdf)
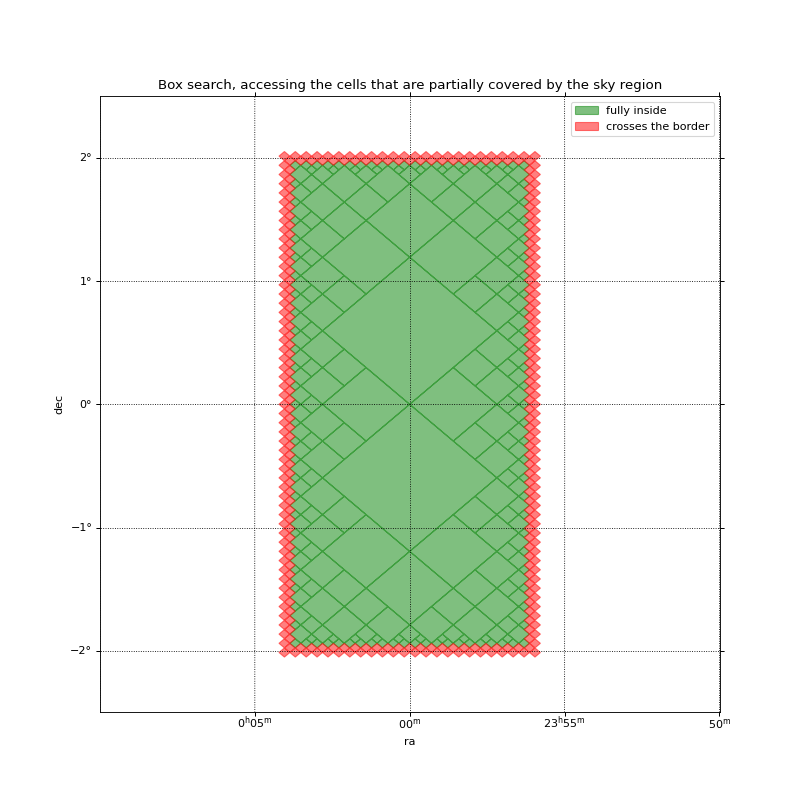
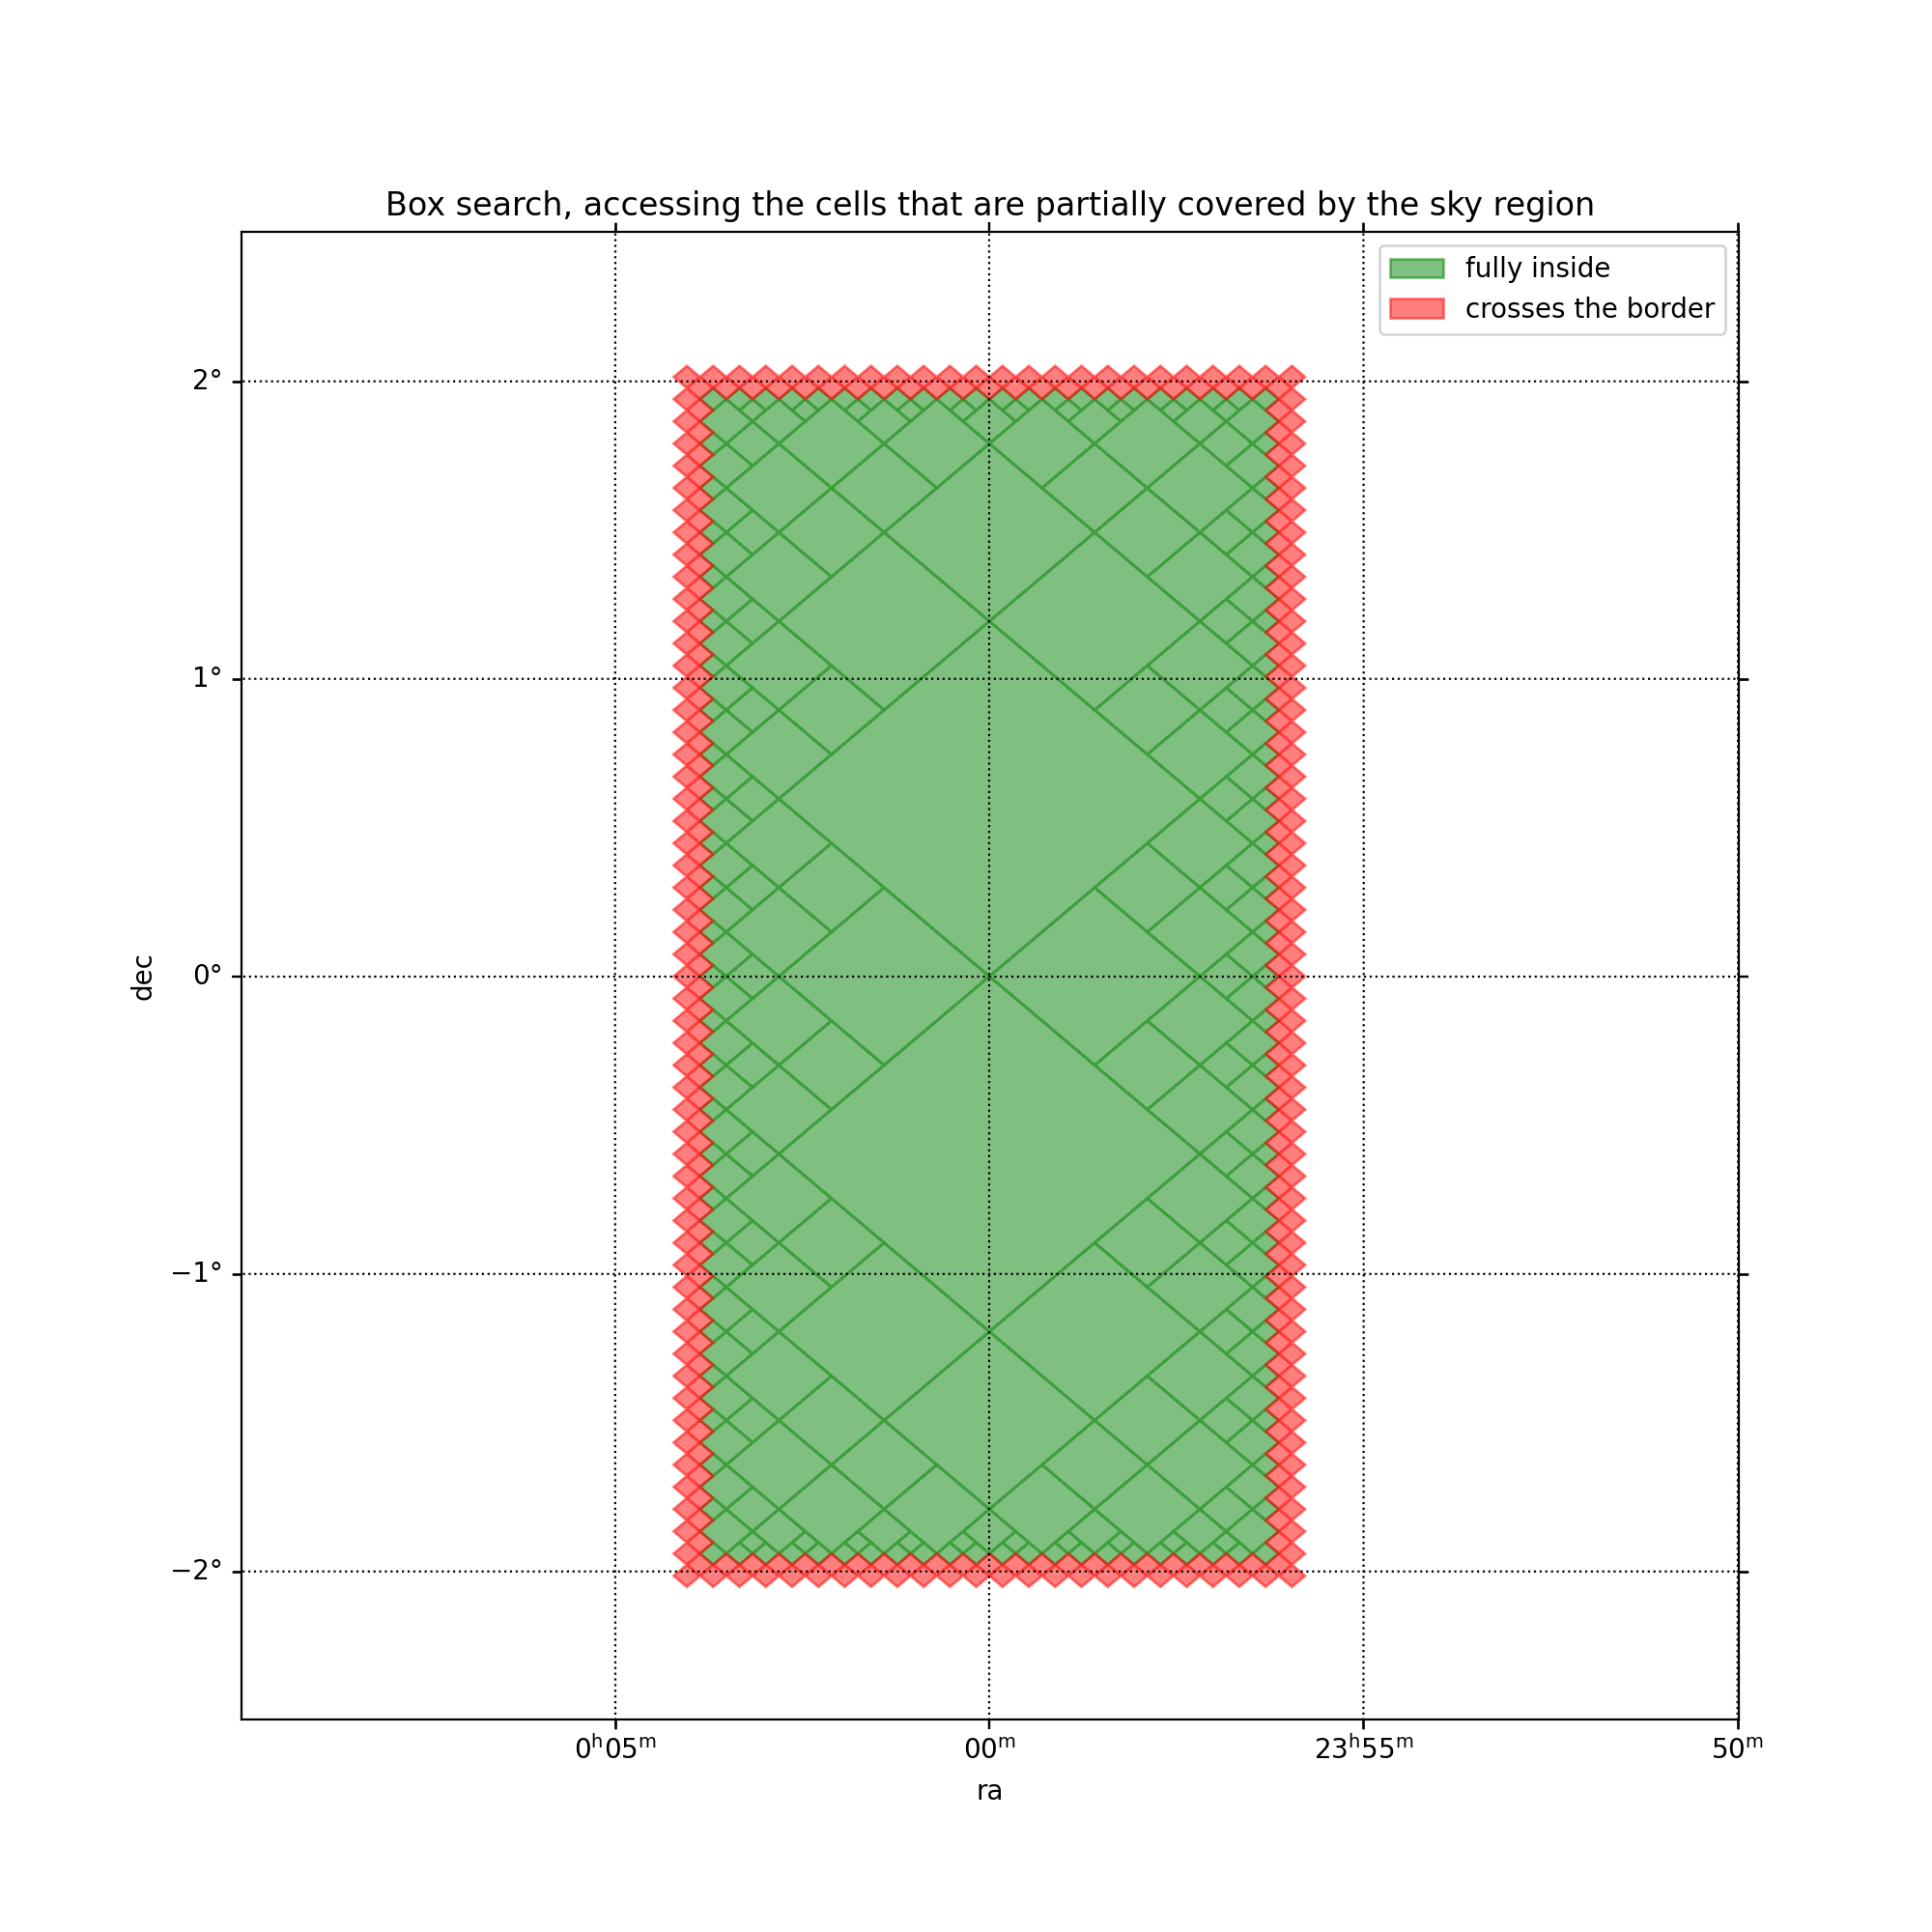
Box search
"""Demonstration of the cone_search function."""

# Astropy tools
import astropy.units as u

# For plots
import matplotlib.pyplot as plt
from astropy.coordinates import Angle, Latitude, Longitude, SkyCoord

# Moc and HEALPix tools
from cdshealpix.nested import box_search
from mocpy import MOC, WCS as mocpy_WCS  # noqa: N811

max_depth = 10

ipix, depth, fully_covered = box_search(
    lon=Longitude(0, u.deg),
    lat=Latitude(0, u.deg),
    a=2 * u.deg,
    b=1 * u.deg,
    angle=0 * u.deg,
    depth=max_depth,
)


moc_fully_covered = MOC.from_healpix_cells(
    ipix[fully_covered], depth[fully_covered], max_depth
)
moc_partially_covered = MOC.from_healpix_cells(
    ipix[~fully_covered], depth[~fully_covered], max_depth
)

# plot
fig = plt.figure(111, figsize=(10, 10))
# Define a astropy WCS from the mocpy.WCS class
with mocpy_WCS(
    fig,
    fov=5 * u.deg,
    center=SkyCoord(0, 0, unit="deg", frame="icrs"),
    coordsys="icrs",
    rotation=Angle(0, u.degree),
    projection="AIT",
) as wcs:
    ax = fig.add_subplot(1, 1, 1, projection=wcs)
    # Call fill with a matplotlib axe and the `~astropy.wcs.WCS` wcs object.
    moc_fully_covered.fill(
        ax=ax, wcs=wcs, alpha=0.5, fill=True, color="green", label="fully inside"
    )
    moc_partially_covered.fill(
        ax=ax, wcs=wcs, alpha=0.5, fill=True, color="red", label="crosses the border"
    )

plt.xlabel("ra")
plt.ylabel("dec")
plt.legend()
plt.title(
    "Box search, accessing the cells that are partially covered by the sky region"
)
plt.grid(color="black", linestyle="dotted")
plt.show()
(Source code, png, hires.png, pdf)

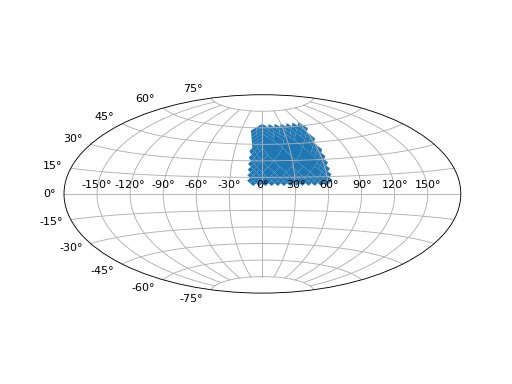
Zone search
In this example, we get the ipix and depth in a zone and plot them by combining
cdshealpix.nested.vertices with matplotlib.path.Polygon
"""Get the HEALPix cells in a zone, and plot all of them as matplotlib polygons."""

from cdshealpix.nested import zone_search, vertices

from astropy.coordinates import Longitude, Latitude

import astropy.units as u
import numpy as np
from matplotlib.collections import PolyCollection
import matplotlib.pyplot as plt

lon_min = Longitude(-10 * u.deg)
lat_min = Latitude(10 * u.deg)
lon_max = Longitude(60 * u.deg)
lat_max = Latitude(60 * u.deg)

ipix, depth, _ = zone_search(lon_min, lat_min, lon_max, lat_max, depth=4)

n_cells = len(ipix)

lons, lats = vertices(ipix, depth, step=4)

lons = lons.wrap_at(180 * u.deg).radian
lats = lats.radian

path_polygons = np.array([np.column_stack((lon, lat)) for lon, lat in zip(lons, lats)])

polygons = PolyCollection(path_polygons)

fig = plt.figure()
ax = fig.add_subplot(projection="aitoff")
ax.grid(visible=True)
ax.add_collection(polygons)

plt.show()
(Source code, png, hires.png, pdf)
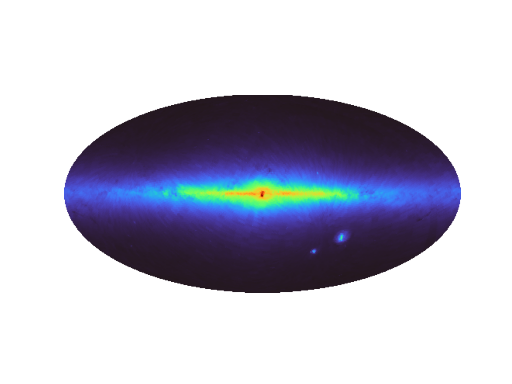
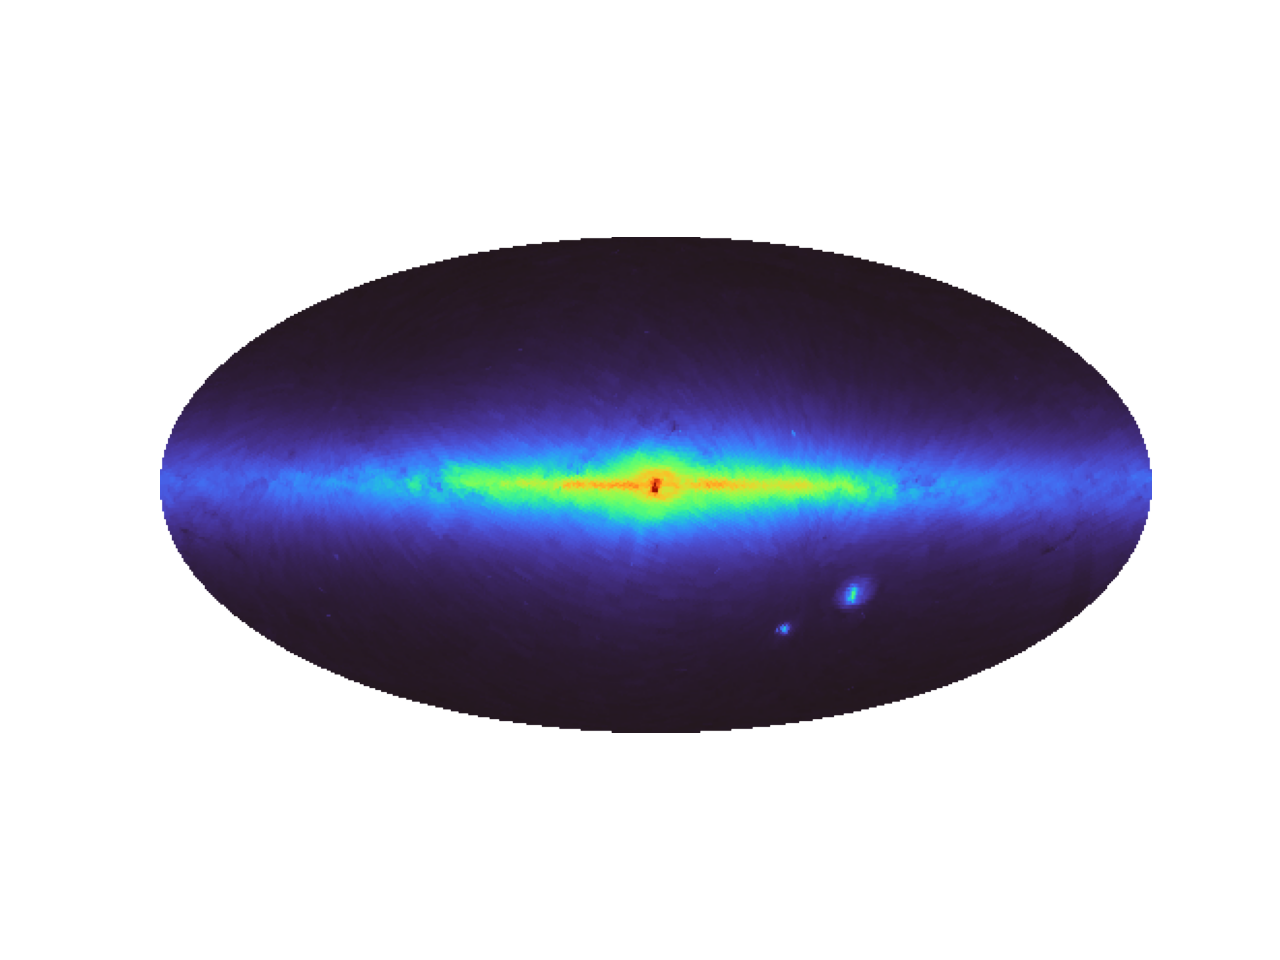
Skymaps
The skymap sub-module allows to manipulate easily all-sky skymaps in the nested ordering
and implicit or explicit schemas.
The class can be instantiated either from a fits file, with
from_fits / from_fits, or directly
with a numpy numpy.array containing the values associated to each HEALPix pixel.
"""Read and plots a quick preview of a skymap in a FITS file."""

from cdshealpix.skymap import SkymapImplicit

my_skymap = SkymapImplicit.from_fits("skymap.fits")
print(my_skymap.order)
my_skymap.quick_plot()
(Source code, png, hires.png, pdf)